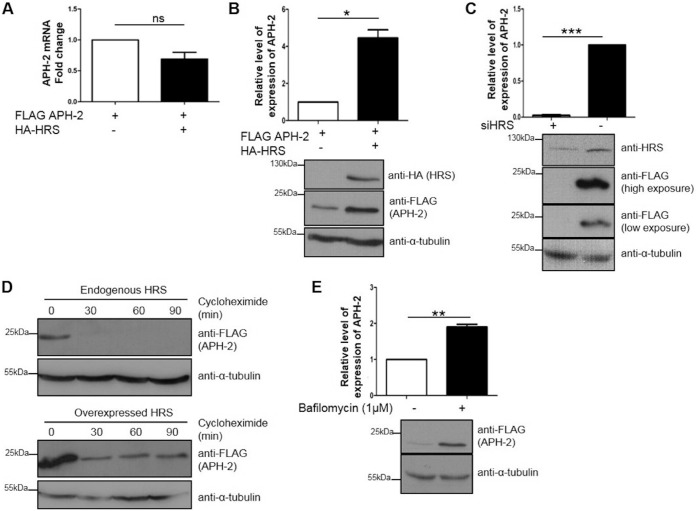
FIG 5.
HRS overexpression increases the half-life of APH-2, and APH-2 is degraded in lysosomes. (A and B) Effects of HRS overexpression on APH-2 mRNA and protein levels. (A) HEK293T cells were cotransfected with FLAG-APH-2 and either FLAG-empty (control) or HA-HRS expression plasmids. Twenty-four hours posttransfection, mRNAs were extracted, and APH-2 expression was measured by qRT-PCR. APH-2 mRNA levels were calculated by the ΔCT method. Values were normalized to β-actin expression and compared to the expression of APH-2 when HRS was not transfected, which was set as 1. (B) HEK293T cells were transfected as described for panel A. Twenty-four hours after transfection, cells were lysed and proteins levels were analyzed by Western blotting using anti-HA, anti-FLAG, and anti-α-tubulin antibodies. The APH-2 level in the absence of exogenous HRS was set as 1. (C) Effect of HRS knockdown on APH-2 expression. HeLa cells were transfected twice with a siRNA against HRS or a control siRNA, at times of 0 h and 48 h; cells were transfected with a FLAG-APH-2 expression plasmid 24 h after the second transfection and were lysed after 24 h. Lysates were analyzed by Western blotting using anti-HRS, anti-FLAG, and anti-α-tubulin antibodies. (D) Effect of HRS overexpression on APH-2 half-life. HEK293T cells were transfected with a FLAG-APH-2 plasmid and an empty control plasmid (top) or a HA-HRS expression plasmid (bottom). Twenty-four hours posttransfection, cells were treated with cycloheximide (100 μg/ml) for the indicated times. Cells were lysed with RIPA buffer, and equal amounts of proteins were analyzed by Western blotting using anti-FLAG and anti-α-tubulin antibodies. (E) Effect of the inhibition of lysosomal acidification on APH-2 degradation. HEK293T cells were transfected with a FLAG-APH-2 plasmid. Twenty-four hours posttransfection, cells were treated with bafilomycin (1 μM) for 4 h. Cells were lysed with RIPA buffer, and equal amounts of proteins were analyzed by Western blotting using anti-FLAG and anti-α-tubulin antibodies. Densitometric analyses were performed in three independent experiments. Results are shown as fold changes in comparison with the control condition, which was arbitrarily set as 1. Error bars represent the standard error of the mean. *, P ≤ 0.05; **, P ≤ 0.01; ***, P ≤ 0.001, ns, not significant, by two-tailed Student's t test.

