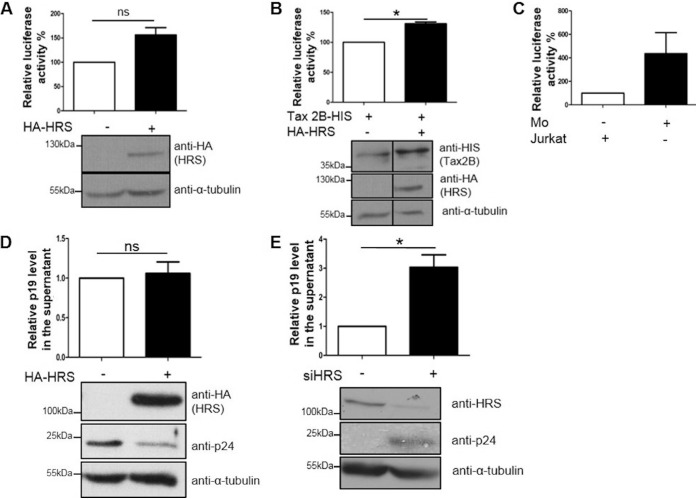
FIG 7.
HRS enhances Tax2B-mediated LTR activation and suppresses HTLV-2 production and release. (A and B) Effects of HRS on basal (A) and Tax2B-mediated (B) LTR activation. HeLa cells were cotransfected with 100 ng of HTLV-2 LTR-luciferase reporter construct, 20 ng of pCAGGS-Tax2B, and 3 μg of HRS or control plasmids as indicated. Luciferase assays were carried out 24 h posttransfection, and results were normalized to the protein concentrations. The mean of three independent experiments is shown. Results are plotted as percentage luciferase activation relative to the control, which was arbitrarily set as 100%. Lysates were subjected to Western blot analysis using anti-HA, anti-His, and anti-α-tubulin antibodies. (C) HTLV-2 infection model. HeLa cells were transfected with 100 ng of HTLV-2 LTR; 24 h posttransfection, similar numbers of Jurkat or Mo cells were added on top of the HeLa cells for 24 h before the cells were washed three times with PBS and incubated for an additional 24 h prior to cell lysis with passive lysis buffer. Luciferase assays were carried out, and values were normalized to protein concentrations. (D and E) Effects of HRS overexpression (D) or knockdown (E) on HTLV-2 Gag levels. HeLa cells were transfected with similar amounts of HA-HRS or control expression plasmids (D) or were double transfected over 24 h with a control siRNA or a siRNA against HRS (E); 24 h posttransfection, similar numbers of Mo cells were added on top of the HeLa cells for 24 h before the cells were washed three times with PBS and incubated for an additional 24 h prior to cell lysis. Protein levels were analyzed by Western blotting using antibodies against HA, HRS, p24, and α-tubulin epitopes. p19gag protein levels in the supernatants were quantified by ELISA. Results are shown as fold changes in comparison with the control condition, which was arbitrarily set as 1. Error bars represent the standard error of the mean. *, P ≤ 0.05; ns, not significant, by two-tailed Student's t test. Data represent three independent experiments.

