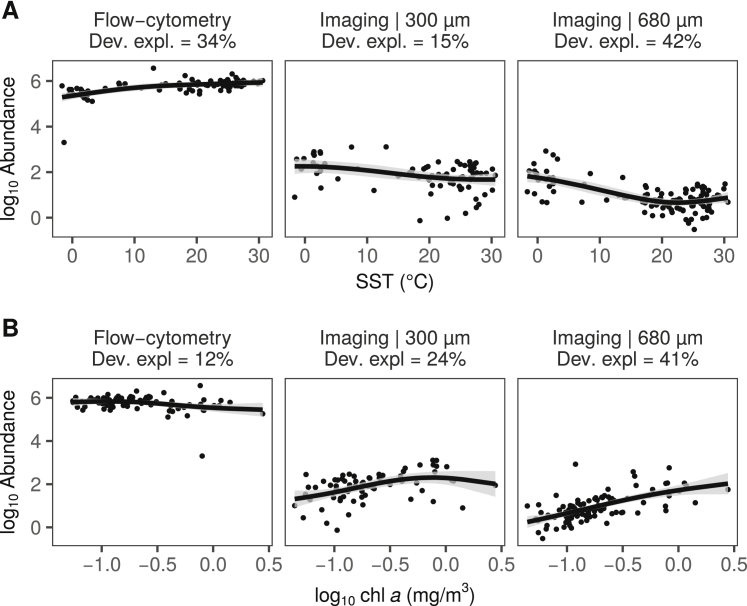
Figure S10.
Relationship between Plankton Abundance and Two Contextual Variables, Related to Figure 3A
(A) SST, (B) chl a. Abundance values were obtained with flow cytometry (reported in [cells/ml]) or from counts of individuals captured with nets of different mesh size and identified by imaging (reported in [individuals/m3]), respectively. Solid lines represent the GAM smooth trends and gray ribbons the corresponding 95% confidence intervals of the X-Y relationship predicted by the GAMs. The percentages provided below inset titles correspond to the deviance explained by GAMs when significant.

