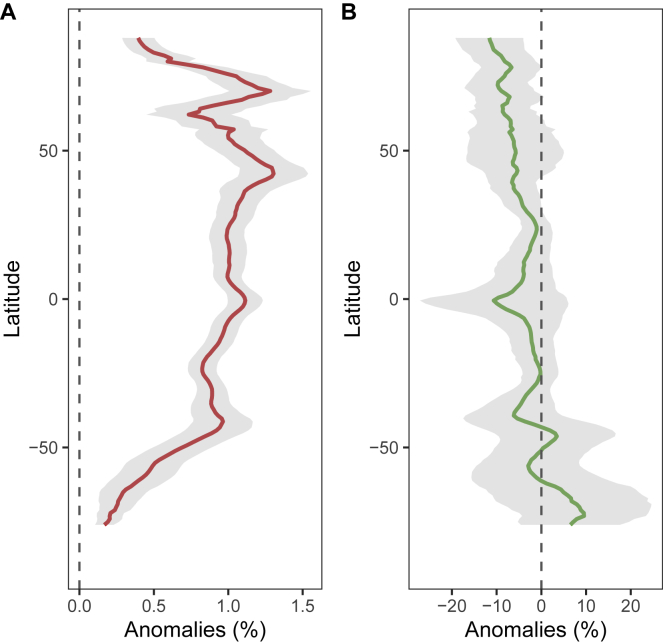
Figure S11.
Projected Latitudinal Changes in SST and chl a, Related to Figures 4 and S12
Anomalies (%) in (A) SST and (B) chl a at the end of the 21st century (2090-2099, RCP 8.5) relative to the beginning of the century (1996-2006). Data was obtained from 13 CMIP5 models (Table S1H). Grey ribbons represent the standard error.

