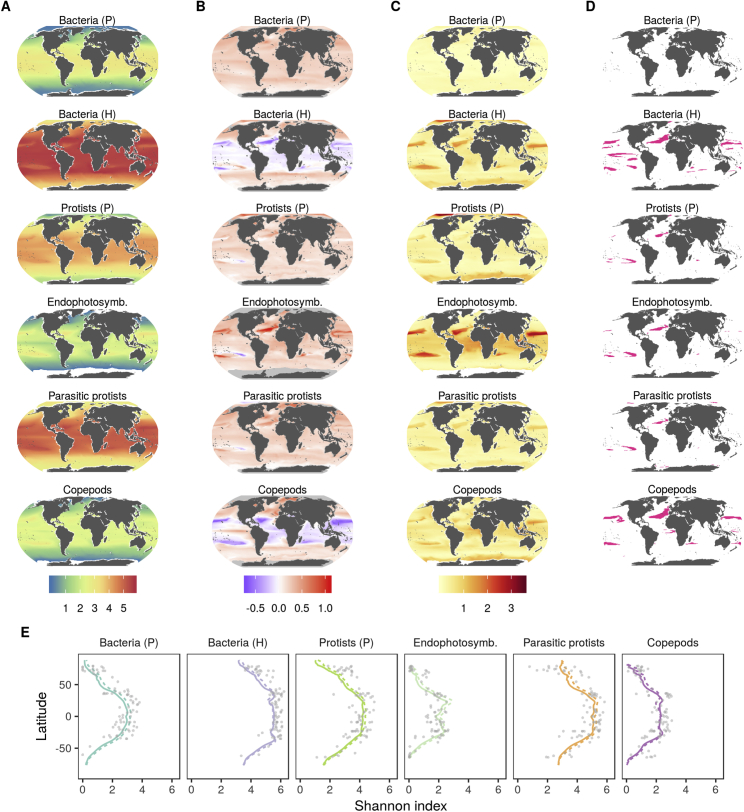
Figure S12.
Modeled Patterns of Diversity of MPGs in the Global Ocean, Related to Figure 4
(A) Shannon index modeled at the global scale for oceanic conditions at the beginning of the 21st century (1996-2006). Predicted Shannon values ≤ 0 obtained at high latitudes, particularly for copepods and endophotosymbionts, were excluded. (B) Anomalies were calculated as the difference of their Shannon index at the end (2090-2099, RCP 8.5) and the beginning of the century (1996-2006). A positive value means that diversity will increase by the end of the century. Note that the scale is not symmetric and that white means zero change. (C) Uncertainty maps (standard deviation) for (B). (D) Areas where the effect of chl a on plankton diversity is likely to be higher than the one of SST. To determine this, either chl a or SST were held constant in the projections by the end of the century. Then, if the anomaly caused only by the change of chl a was different than zero and higher (absolute terms) than the one caused only by the change in SST, the pixel was colored. (E) Latitudinal diversity gradient at the beginning (solid line) and the end (dashed line) of the 21st century. Values represent averages over longitude for each latitudinal degree. Dots are observed values (Figure 2). 13 Earth system models from CMIP5 were used (Table S1H).

