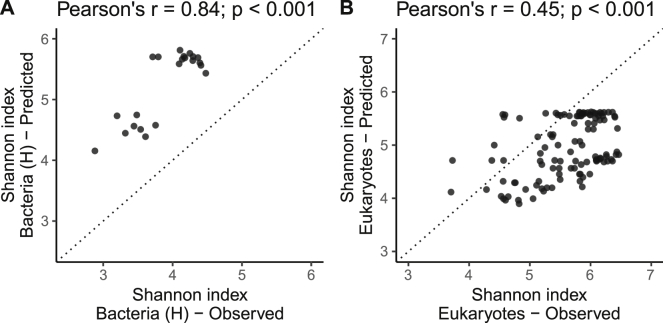
Figure S13.
Correlation between the Shannon Values Observed in Independent Datasets and Those for the Same Locations that Are Predicted by GAM Models Built in This Work, Related to STAR Methods
(A) Heterotrophic bacteria from the surface, open ocean water sites of the International Census of Marine Microbes (ICoMM; Zinger et al., 2011). (B) Eukaryotic community retrieved from Raes et al. (2018). Note that for the latter the mesh size of the filters used were not exactly the same (Tara Oceans > 0.8 μm; Raes et al., 2018 > 0.22 μm). Note also that both datasets have different sampling dates and locations in relation to Tara Oceans. In both cases we used as predictors the temperature and chl a of each site predicted by 13 CMIP5 models at the month of sampling averaged over 1996-2006. Inset titles show the Pearson’s correlation coefficient and its associated p value.

