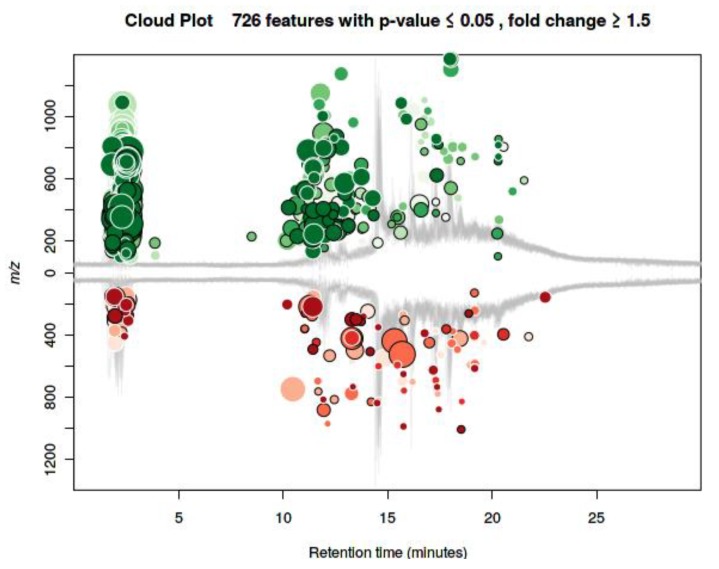
Figure 2.
Cloud plot of the metabolomics modulated features (fold change ≥ 1.5, p-value ≤ 0.05). Feature signals belonging to molecules defined by m/z and retention time. Differential analysis based on the intensity of the signals in PRE versus POST run sera. Green and red circles represent the upregulated and downregulated features, respectively. The size value of each circle corresponds to (log) fold change. Color shades are used to represent the p-value, with brighter circles indicating lower p-values. The retention time corrected (TIC) total ion chromatograms are overlaid in gray in the figure background.

