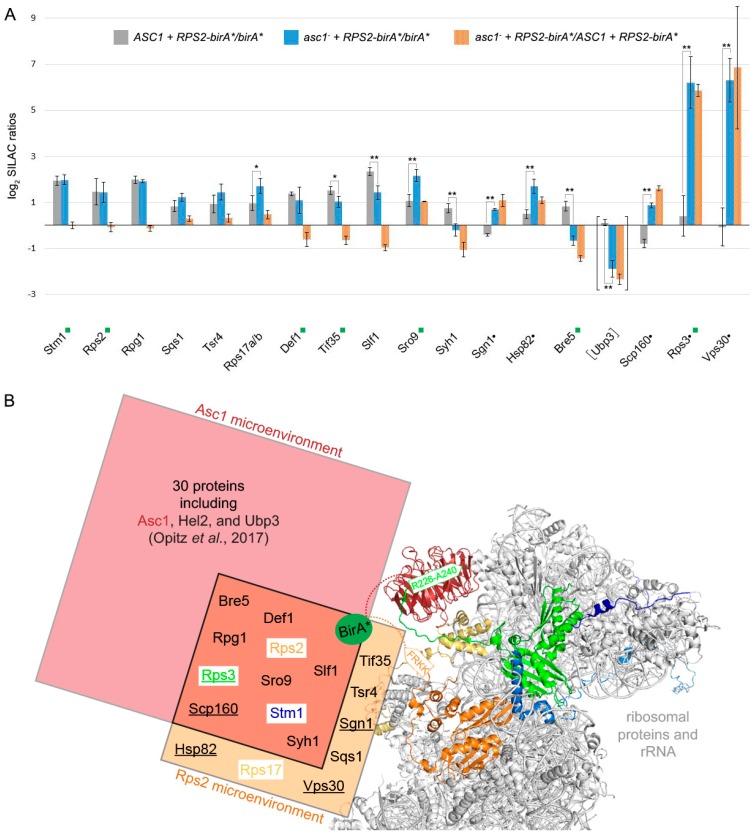
Figure 2.
BioID protein capture after Rps2-BirA*-labeling in the presence or absence of Asc1. (A) All columns represent the average of MaxQuant normalized log2 SILAC ratios of three biological replicates and are provided with the respective standard deviations. Proteins depicted in the graph were enriched with normalized log2 SILAC ratios for ASC1 RPS2-birA*/birA* greater than or equal to 0.485 (matching a minimum enrichment of approximately 40%) from either ASC1 wild-type cells (gray columns) and/or from asc1− cells (blue columns). Black dots next to protein names indicate proteins that were exclusively enriched from the asc1− cells. Orange columns represent the respective fold-changes of the SILAC protein quantification values between ASC1 wild-type and asc1− cells, indicating the degree of Asc1-dependency in their Rps2 proximal localization. The proteins are ordered from left to right according to increasing absolute differences in enrichment between ASC1 wild-type and asc1− cells (orange columns). A two-sample t-test on the ASC1 RPS2-birA*/birA* versus asc1− RPS2-birA*/birA* log2 SILAC ratios was performed, and significant changes were indicated with one or two asterisks (p-value threshold 0.05 and 0.01, respectively). A green rectangle next to the protein name indicates the identification of a biotinylated peptide for the respective protein. Although the data for Ubp3 did not pass the described filtering, they are provided for the discussion (see main text). The graph is based on the data in Table S1. (B) Comparison of the Asc1 and Rps2 microenvironments captured with BioID: The hr40S is illustrated as in Figure 1A. The biotin ligase BirA* (green sphere) was fused via a linker sequence to the C-termini of either Asc1 or Rps2 (indicated with dashed lines in red and orange, respectively). The proteinaceous microenvironment of Asc1 [18] is indicated with a red rectangle and that of Rps2 with an orange one. Proteins identified in the neighborhood of both proteins are listed in the overlap of both rectangles and are supposed to belong to a common microenvironment. Proteins only identified in the absence of Asc1 within the Rps2 microenvironment are underlined. Proximity between Asc1 or Rps2 to their neighboring proteins might also take place apart from a mature 40S ribosomal subunit. The PyMOL Molecular Graphics System software was used to generate the figure from crystal structure data of the S. cerevisiae 80S ribosome (PDB entry: 4V88) [15].

