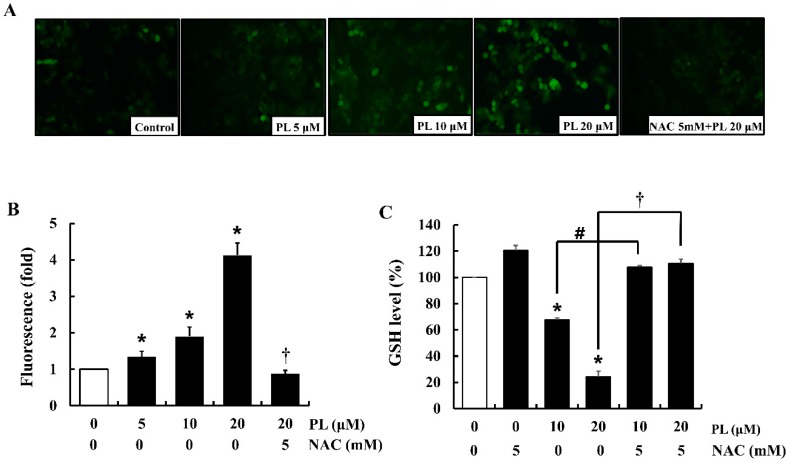
Figure 4.
Effects of piperlongumine (PL) on ROS level and intracellular GSH in MCF-7 cells. (A) Cells were stained with DCFH-DA to detect ROS (H2O2) production. The intensity of green fluorescence (H2O2 production) was determined using a fluorescence microscope. The images shown are representatives of three independent experiments. (B) DCF-DA positive (green fluorescence) area was analyzed with Image J. (C) GSH levels were measured using a fluorometric assay. The fluorescence value was determined by a fluorescence microplate reader. Data represent the mean ± SEM (n = 3). * Significantly different compared with that of the control (p < 0.05). # Significantly different compared to that of 10 µM PL (p < 0.05). † Significantly different compared to that of 20 µM PL (p < 0.05).

