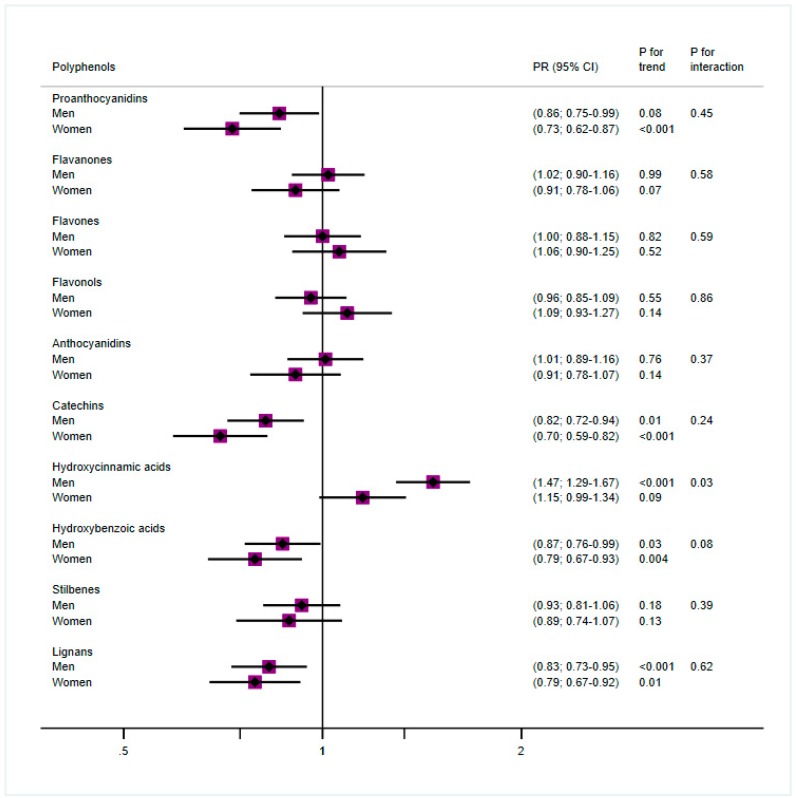
Figure 1.
Cox proportional models for polyphenol groups and type 2 diabetes (T2D) by sex, comparing quartile 4 (Q4) vs. quartile 1 (Q1) and adjusted for age, education (basic studies, medium, high), body mass index (BMI) (overweight, obese), smoking (never, former, smoker), physical activity (quintiles), energy, consumption of refined cereals and animal products (from 17-point questionnaire) and of distilled beverages and liquors, sugar, soft drinks, cookies, and pastries (g/day), and stratified by recruitment center.

