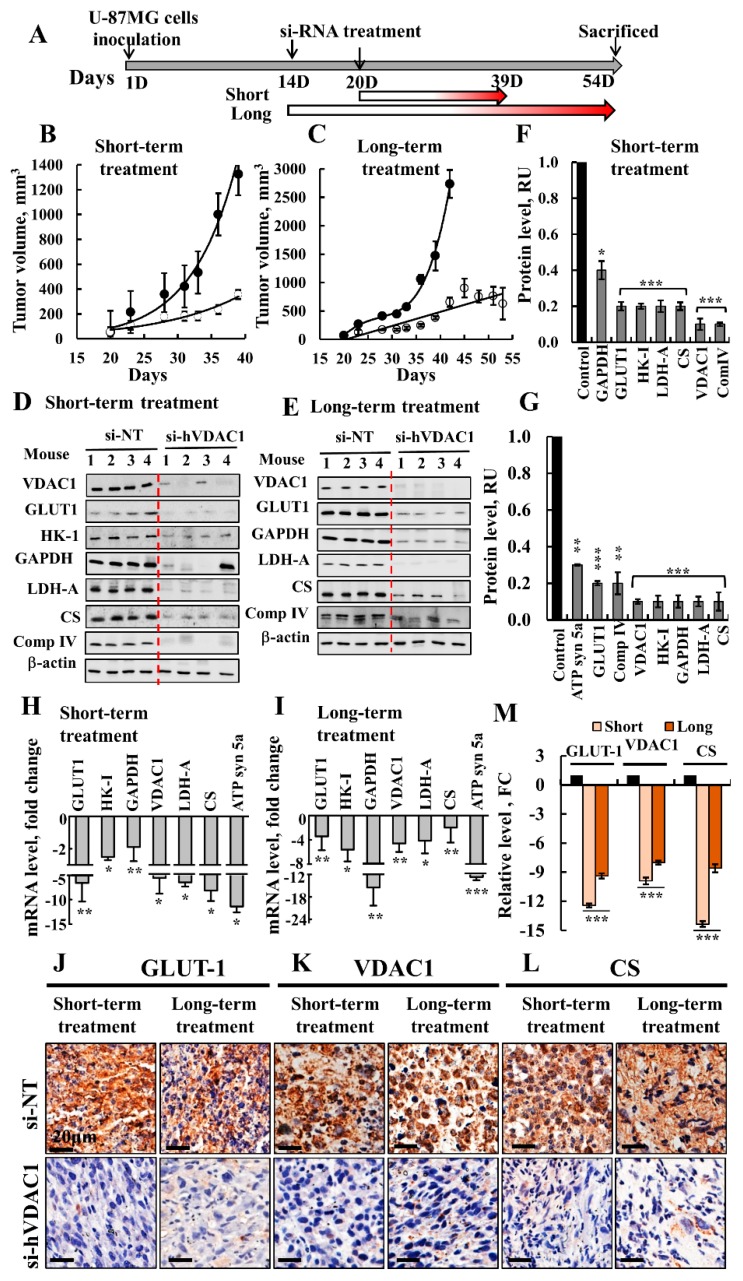
Figure 1.
Inhibition of tumor growth and metabolism reprograming in a mouse GBM xenograft model following short- and long-term treatment with si-hVDAC1. (A) Schematic representation of the GBM xenograft in a mouse and si-hVDAC1 treatment applied for short and long periods. (B, C) U-87MG cells were s.c. inoculated into nude mice. When tumor volume reached 50–100 mm3, the mice were divided into matched 2 groups, and the tumors were treated every 3 days with si-NT (●, 5 mice) or si-hVDAC1 (○, 5 mice) to a final concentration of 50–60 nM for 19 days (B) or 40 days (C). The calculated average tumor volumes are presented as means ± SEM; p: * ≤ 0.05; ** ≤ 0.01; *** ≤ 0.001. Immunoblots (D,E) and the quantitative analysis (F,G) of metabolism-related proteins from si-NT-TTs and si-hVDAC1-TTs, treated with si-hVDAC1 for short (D,F) or long periods (E,G). (H,I) q-RT-PCR analysis of the indicated genes presented as fold change in si-NT-TTs and si-hVDAC1-TTs obtained from U-87MG tumors treated for short (H) or long periods (I). IHC analysis of tumor sections obtained from tumors treated with hVDAC1 or si-NT for short or long periods and stained for Glut1 (J), VDAC1 (K) and CS (L) using specific antibodies with quantitative analysis (M). Quantification of the image staining intensity was generated using a panoramic microscope and HistoQuant software (Quant Center 2.0 software, 3DHISTECH Ltd). All data are expressed as Mean ± SEM, (n = 3 tumors) (* p < 0.05; ** p < 0.01, *** p < 0.001).

