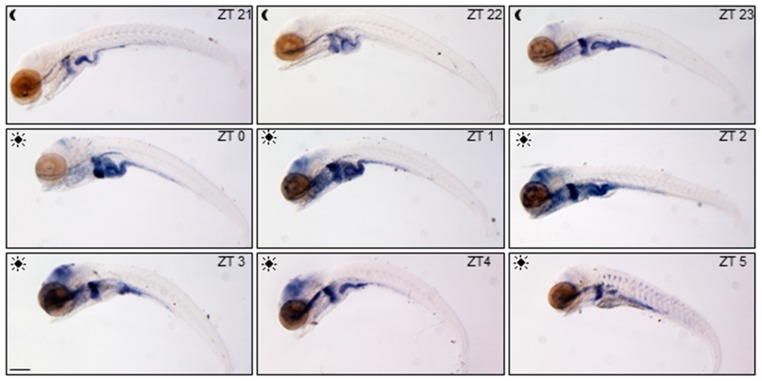
Figure 1.
Spatial and temporal variations of glucocorticoid activity. WMISH of egfp mRNA in 5-dpf ia20 larvae exposed to standard photoperiodic regime and analyzed from 3 h before to 5 h after light onset (from ZT21 to ZT5). All larvae are lateral views with head pointing to the left. Scale bar: 200 µM.

