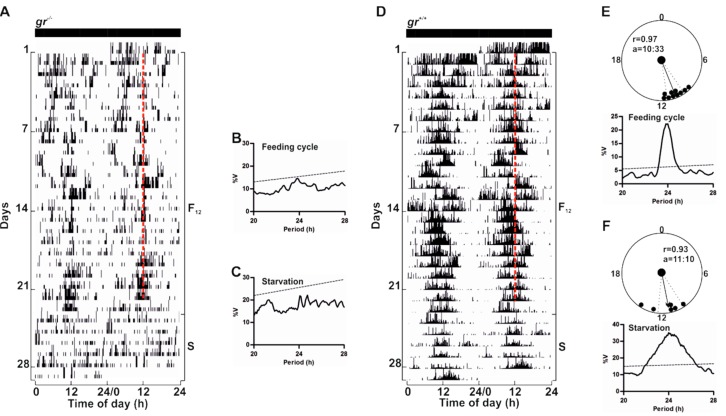
Figure 10.
Behavioural entrainment by periodic food availability of gr+/+ and gr−/− adult zebrafish. Representative actograms (A,D), χ2 periodogram analysis and circular diagrams (B–C,E–F) of adult zebrafish gr+/+ and gr−/− maintained under constant darkness and fed once a day at a fixed time (12:00). Starting and ending day of each feeding cycle (F12) and starvation (S) is shown on the right of the actogram. The number of days is indicated on the left and the time of day is plotted on the bottom of each actogram. Red dotted lines indicate the time of feeding. Circular diagrams showing acrophases for F12 and S period are plotted (E–F). Activity records of each F12 or S cycle were subjected to χ2 periodogram analysis (B–C,E–F). For more details see Figure 5.

