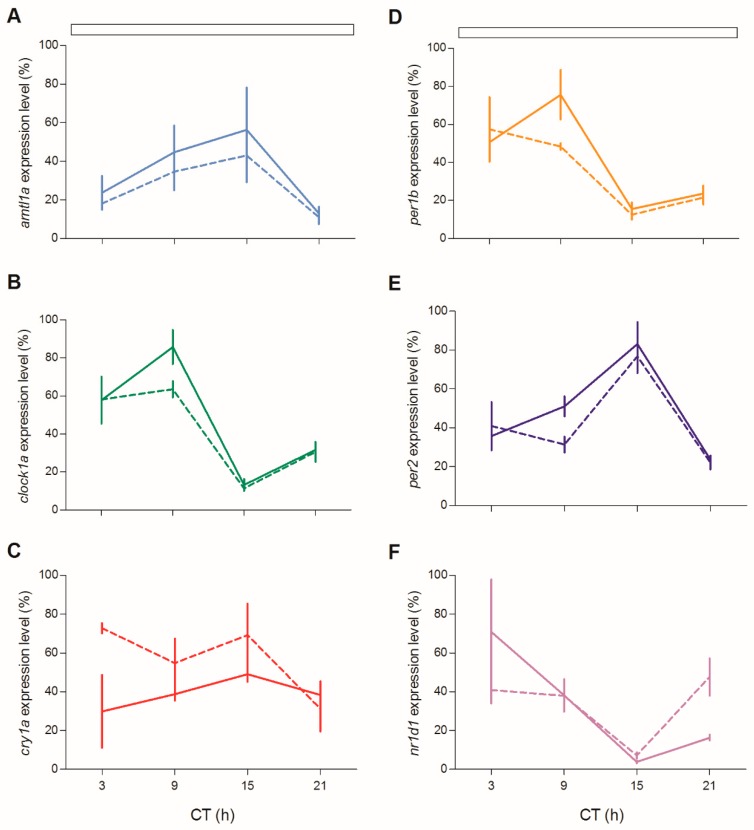
Figure 12.
Circadian expression levels of clock genes in zebrafish juvenile. qPCR analysis of clock (A,B,D,F) and light-regulated clock (C,E) gene expression in zebrafish juvenile at the third day of starvation after feeding entrainment. White bars represent LL. For more details see Figure 4.

