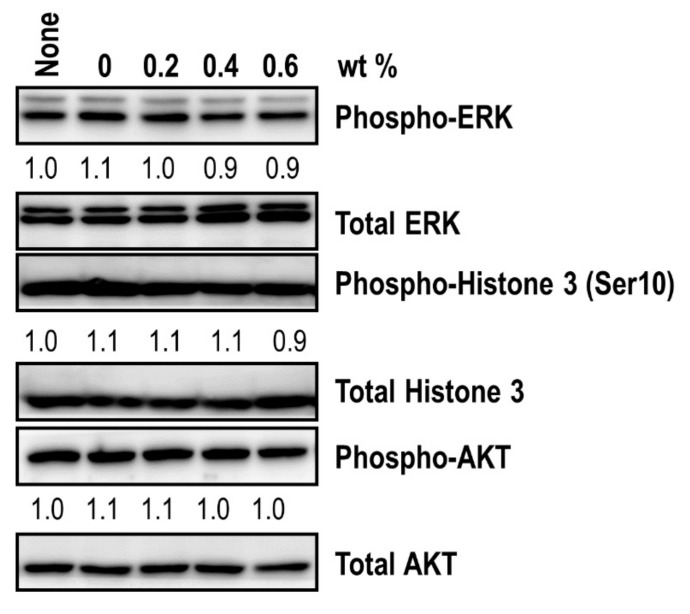
Figure 9.
Western blot analysis of mitotic signatures following the administration of a coating material. Immunoblot analysis of phospho-ERK, phospho-histone 3 (Ser10), and phospho-AKT levels was performed after specimen introduction. The protein levels of total ERK, total histone 3, and total AKT were also measured to determine the phosphorylation level of each molecule. The relative band intensities of the phosphoproteins are shown below the bands. The sample without a specimen challenge was indicated as none. The intensity of the untreated sample was arbitrarily set to 1.

