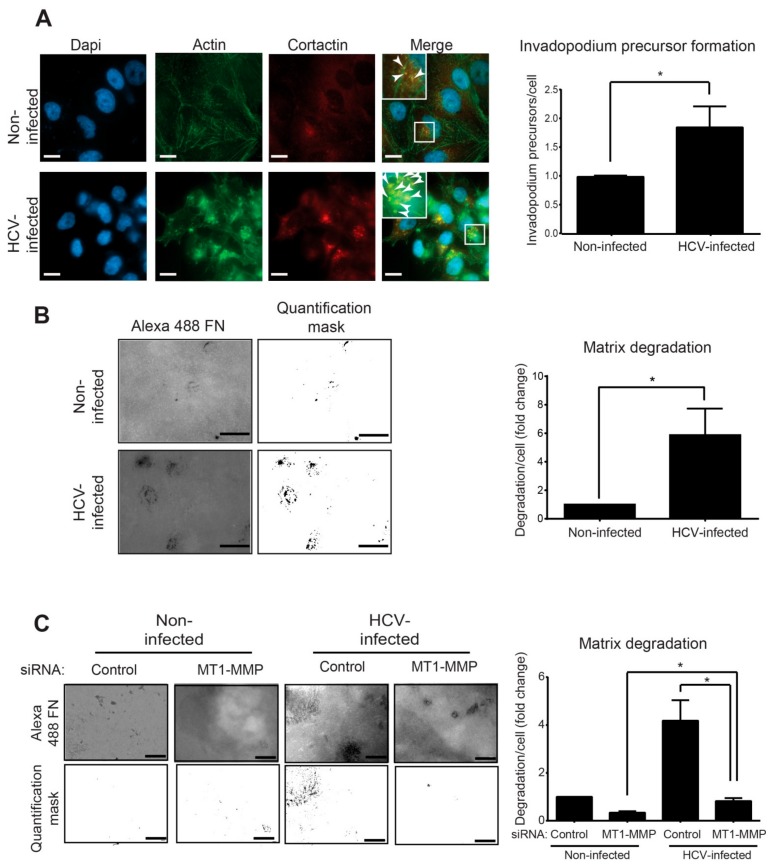
Figure 3.
Infection with HCV enhances invadopodium precursor formation and activation. (A) Left: HCV-infected and non-infected Huh7.5 cells were plated on unlabeled gelatin, fixed, and immunostained for actin (green) and cortactin (red). Boxed regions and insets depict localization of actin dots and cortactin as markers of invadopodium precursors. Bar, 5 μm. Right: Quantification of invadopodium precursors per cell in non-infected and HCV-infected cells. n = 40 cells per group from three independent experiments. (B) Left: HCV-infected and non-infected Huh7.5 cells were plated on Alexa 488 gelatin and allowed to degrade for 72 h. Shown are representative images (left panel) and quantification masks (right panel) of degradation areas. Bar, 5 μm. Right: Quantification of matrix degradation by non-infected and HCV-infected cells. n = 10 fields per group from three independent experiments. (C) Left: HCV-infected and non-infected Huh7.5 cells were transfected with control siRNA or with MT1-MMP siRNA for four hours. Cells were then plated on Alexa 488 gelatin and allowed to degrade for 72 h. Shown are representative images (left panel) and quantification masks (right panel) of degradation areas. Bar, 5 μm. Right: Quantification of matrix degradation by non-infected and HCV-infected cells expressing either control or MT1-MMP siRNA. n = 10 fields per group from three independent experiments. * p < 0.05, Student’s t-test.

