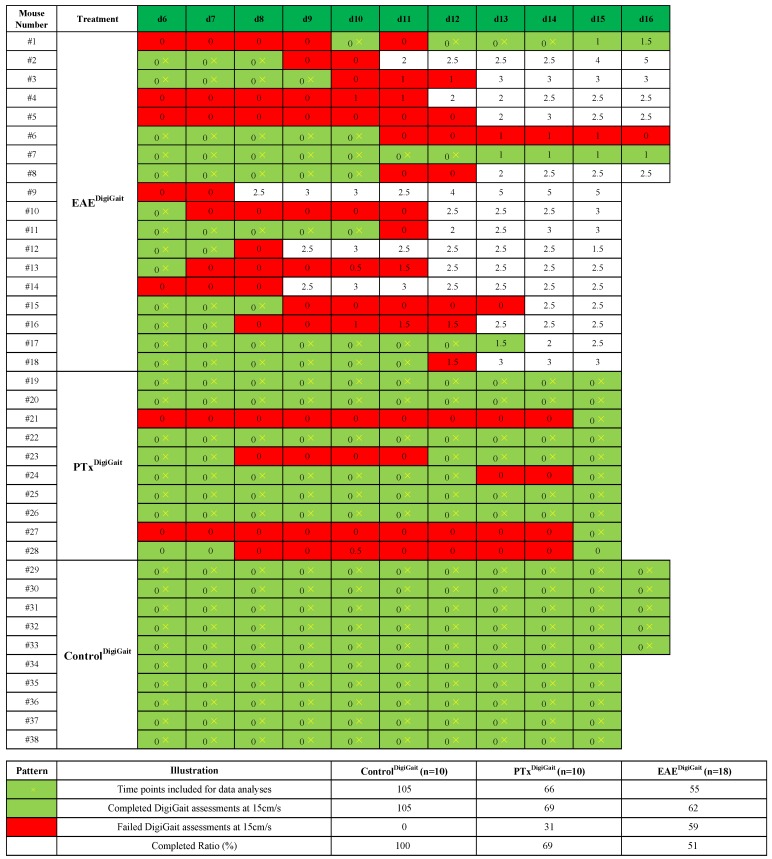
Figure 4.
Summary of gait analyses experiments. Days with successfully conducted DigiGaitTM recordings are highlighted in green, whereas days on which no DigiGaitTM recordings could be performed are highlighted in red. Numbers in the boxes indicate the level of motor behavior deficits evaluated by classical EAE scoring. Yellow crosses indicate time points included for data analyses.

