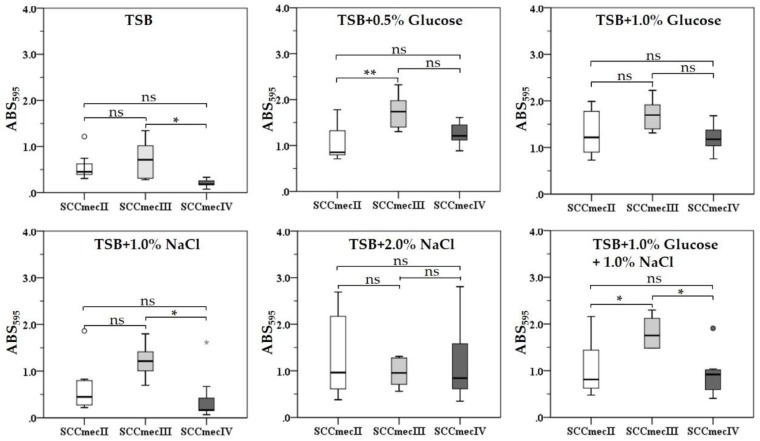
Figure 3.
Biofilm formation by MRSA strains with distinct SCCmec types (SCCmec II, n = 8; SCCmec III, n = 6; and SCCmec IV, n = 7) grown in different culture media compositions. Box plot shows the median (horizontal thick blank line) of biofilms formed by MRSA strains. The lower and higher edges of the box represent the 25th and 75th percentiles, respectively. Box plot whiskers represent the 90th and 10th percentiles. P values were determined using Student′s t-test and asterisks indicate statistical significance (* = p ≤ 0.05, ** = p < 0.01). (ns = p > 0.05, not statistically significant).

