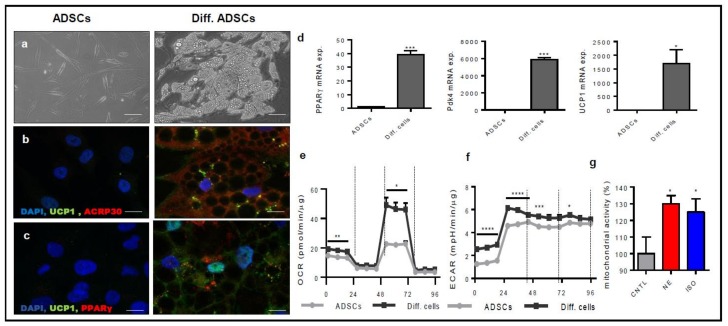
Figure 2.
ADSCs differentiate into beige-like adipocytes. (a) The morphology of ADSCs and ADSC derived beige cells (Diff.) was analyzed at Day 15 of differentiation (Scale bar 100 μm). (b,c) Immunofluorescent detection of expression levels of UCP-1 (green) and ACRP30 (red) (b) and PPARγ (red) (c). Nuclei were counterstained with DAPI. (Scale bar 10 μm). (d) PPARγ, Pdk4, and UCP1 mRNA expression levels were measured by RT-qPCR analysis. Data are the mean ± SEM (n = 6) and are expressed as relative expression ratios (ΔΔCt – fold increase). (e,f) Mitochondrial energy metabolism was measured using the Agilent Seahorse Cell Mito Stress Test. The oxygen consumption rate (OCR) (e) and extracellular acidification rate (ECAR) (f) of ADSCs and ADSC derived beige cells was recorded before and after treatment with 10 μM oligomycin, 10 μM carbonyl cyanide p-trifluoromethoxy-phenylhydrazone (FCCP), and 5 μM rotenone/antimycin A. Data were analyzed according to the Agilent Seahorse XF Cell Mito Stress Test Report Generator. (g) Mitochondrial activity of ADSC derived beige cells was measured by the MTT test in the absence or in the presence of norepinephrine and isoproterenol. * p < 0.05; ** p < 0.01; *** p < 0.005; **** p < 0.001, one-way ANOVA followed by Bonferroni’s test versus the control.

