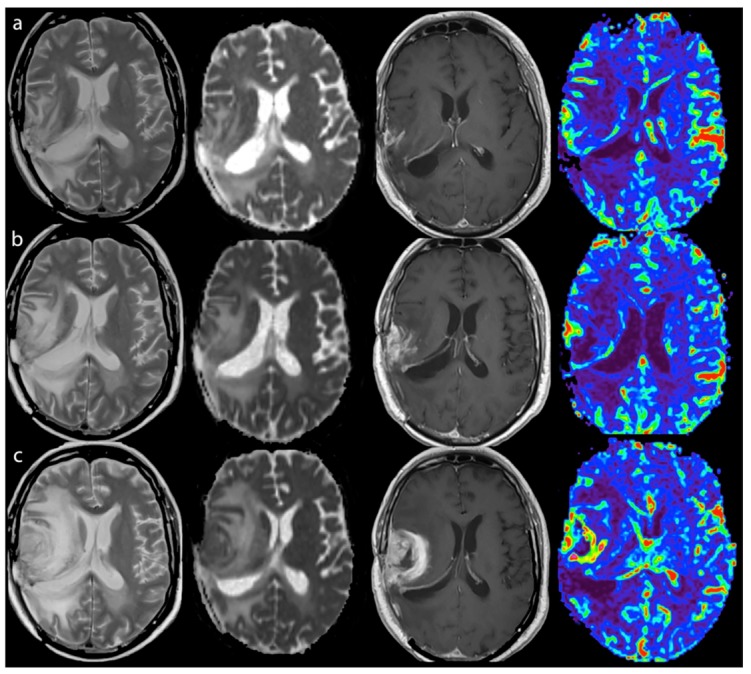
Figure 2.

True tumor progression during immunotherapy of a LowNK and Unmethylated MGMT patient - Left to right: T2, ADC map, T1-enhanced and CBV map. (a) Oct 2013 after surgery and radio-chemotherapy and first four vaccinations, MRI-2 mo (Steroid dose 3 mg Dexamethazone, clinical condition stable): small GBM residual showing contrast enhancement (T1) and a spot of hyper-perfusion with high CBV (red to green), moderate edema and post-actinic alteration (T2 hyper-intensity) and slight ADC restriction; (b) Jan 2014, MRI-6 mo during immunotherapy (Steroid dose 3 mg Dexamethazone, clinical condition stable): enlargement of enhancing, of hyper-perfused and of ADC restricted volumes and of edema; (c) Mar 2014, MRI-8 mo after immunotherapy (Steroid dose 8 mg Dexamethazone, clinical condition worsening): further extension of enhancement with thick ring pattern due to central necrosis, more intense and wide hyper-perfusion and ADC restriction of the enhancing lesion, increased edema with mass effect. CBV, Cerebral Blood Volume; ADC, Apparent Diffusion Coefficient; MGMT, O (6)-methylguanine-DNA methyltransferase.
