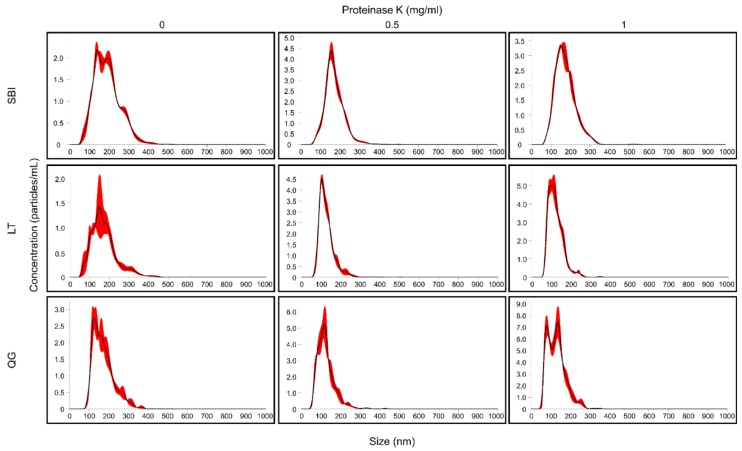
Figure 5.
Size distribution and quantification analysis of ELV preparation by nanoparticle tracking analysis (NTA). The number of particles (×107) per mL and size distribution for each preparation (1:500 dilution) is shown. The calculated size distribution of particles is depicted as a mean (black line) with standard error (red shaded area).

