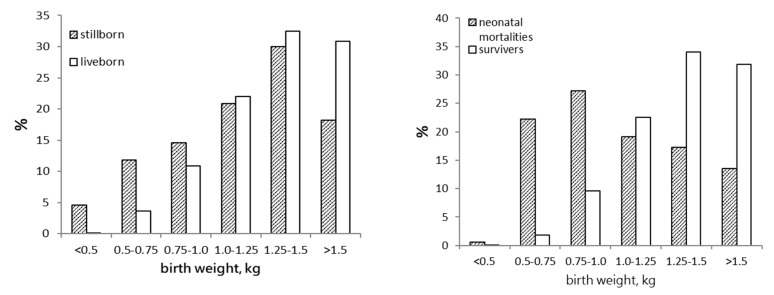
Figure 1.
Distribution over different birthweight classes for stillborn piglets and liveborn piglets that survived to weaning (left panel) and neonatal mortalities and liveborn piglets that survived to weaning (right panel). The percentage on each Y-axis represents the percentage of piglets in each category (stillborn, neonatal mortalities, or liveborn piglets that survive to weaning) that fall into a particular birthweight class. In total, 1856 piglets were recorded (unpublished data). The data show that stillborn piglets and piglets that survive to weaning have a similar birthweight distribution, but that neonatal mortalities are skewed towards low birthweights.

