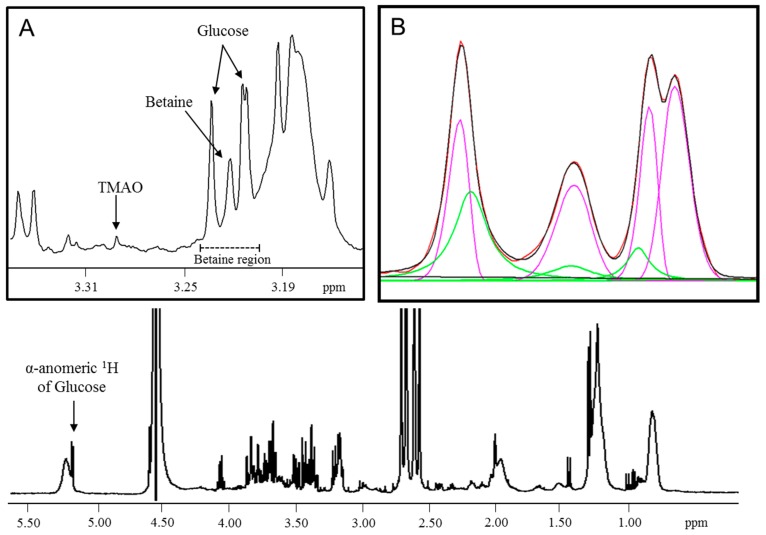
Figure 1.
1D 1H CPMG NMR spectrum of serum used for modeling the betaine peak. (A) Expansion of the spectrum where the betaine region is extracted for lineshape deconvolution. (B) The experimental (red) spectrum overlaid with a mathematical fit (black) from a composite of lognormal (pink) and Lorentzian (green) lineshapes after subtraction of the baseline in the betaine region. ppm = parts per million; CPMG, Carr–Purcell–Meiboom–Gill; NMR, nuclear magnetic resonance.

