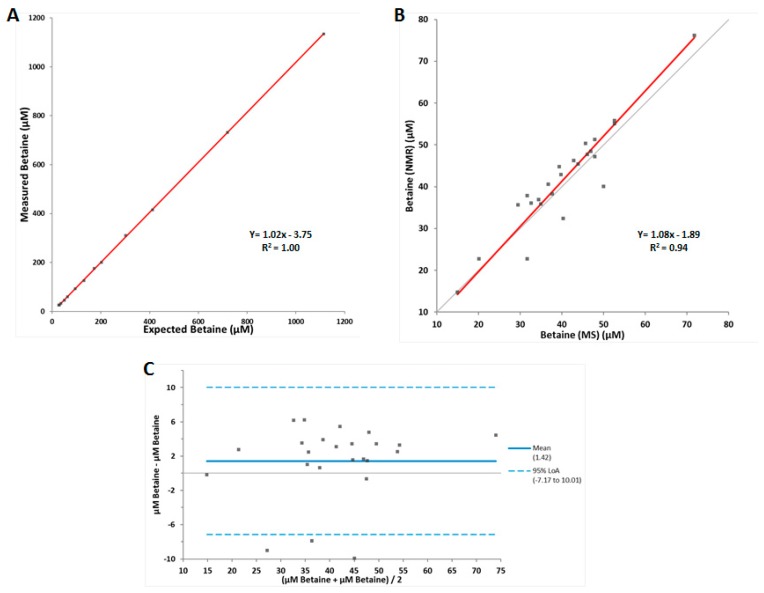
Figure 2.
Linearity and method comparison data for the betaine assay. (A) Results of linearity study (n = 13), (B) Deming regression comparison between LC-MS/MS and NMR measured betaine in serum samples (n = 24), (C) Bland–Altman plot (n = 24). The limits of agreement (LoA) are depicted as dotted blue lines, and the 0% bias is a solid black line.

