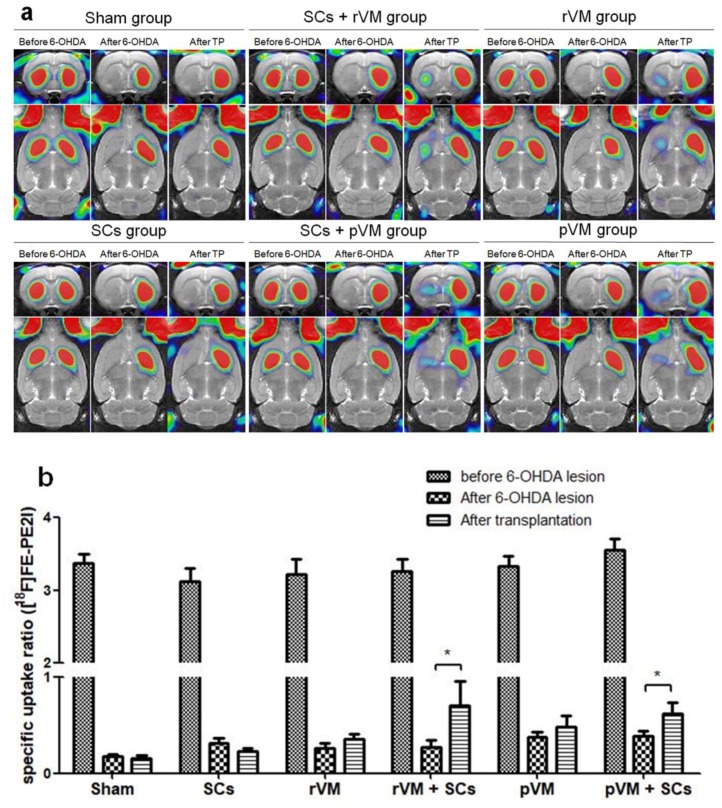
Figure 5.
PET images of [18F] FE-PE2I uptake distribution in rat brains. (a) Coronal (upper panel) and horizontal (lower panel) sections of each group were acquired 20–40 min after injection of [18F]FE-PE2I. Left, middle, and right columns of each group represent [18F]FE-PE2I uptake before the 6-OHDA lesion, after the 6-OHDA lesion, and after transplantation with different grafting materials, respectively. (b) SURs of [18F] FE-PE2I in the grafted striatum at different time points and under different grafting conditions (* p < 0.05).

