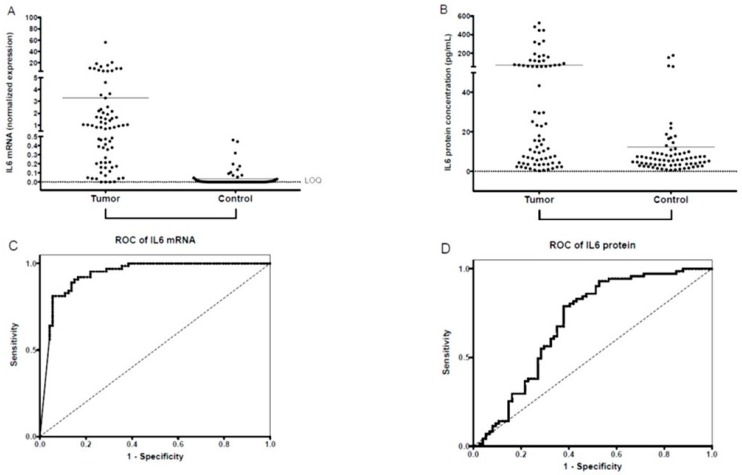
Figure 1.
Salivary IL-6 mRNA and IL-6 protein expression. Expression of normalized salivary IL-6 mRNA (A) and salivary IL-6 protein (B) in patients with OSCC and controls. The horizontal lines indicate the mean. The p values are derived from the Mann-Whitney U test. Differences between Tumor and Control groups proved significant at p < 0.001 for both salivary IL-6 mRNA normalized values and for salivary IL-6 protein concentrations (p < 0.05 was considered significant). Dotted lines indicate the limit of quantification (LOQ). Receiver operating characteristic (ROC) curves for diagnostic ability of IL-6 mRNA (C) and protein (D) levels in saliva for OSCC. AUC for IL-6 mRNA = 0.9379 (p < 0.001; 95% confidence interval: 0.8973–0.9795; sensitivity: 0.945; specificity: 0.819); AUC for IL-6 protein = 0.6981 (p < 0.0001; 95% confidence interval: 0.6105–0.7858; sensitivity: 0.622; specificity: 0.789).

