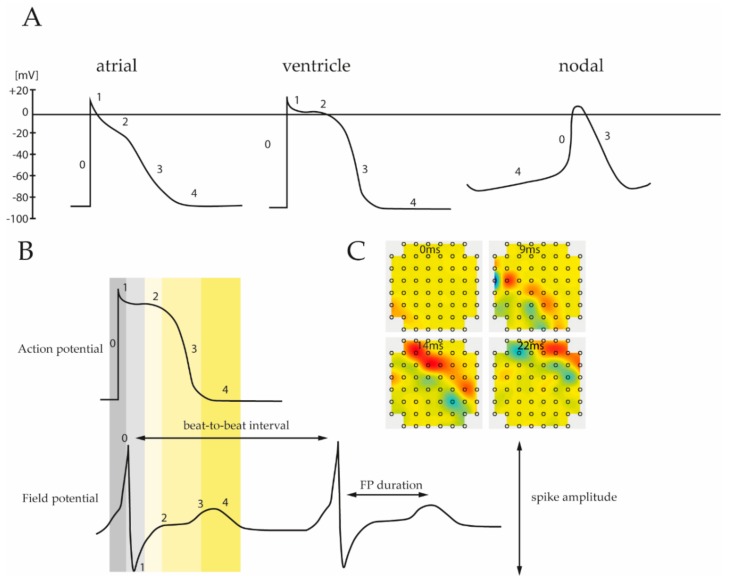
Figure 2.
(A) Subtype specific pattern of the cardiac action potential. Ventricular, atrial and nodal cells are characterized by unique depolarization and repolarization processes leading to different action potential (AP) waveforms. Numbers correspond to the different phases that reflect the activity of involved ion channels. (B) Comparison of the different phases between recorded action potential and field potential. As field potential measurements allow reconstruction of the corresponding action potential it provides important physiological parameters of electrically active cells, including spike amplitude, FP interval, etc. (C) Moreover, MEA analysis can be applied to obtain data about prolongation velocity and direction of the field potential spreading throughout the cell layer.

