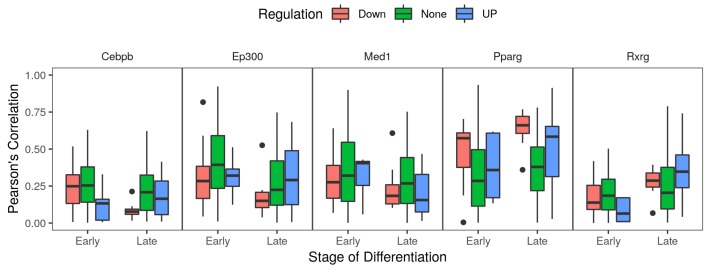
Figure 3.
Co-expression of autophagy products with adipogenic transcription factors. The read counts of five genes coding for adipogenic transcription factors/co-factors and 158 autophagy genes were used to calculate the co-expression values of each of the factors with autophagy genes. Pearson’s correlation co-efficient were calculated from RNA-Seq samples (n = 66) of MDI-induced 3T3-L1 cells in three differentiation stages; non, early and late differentiating cell. Genes were stratified by their differential expression into down- (red), none- (green) or up-regulated (blue).

