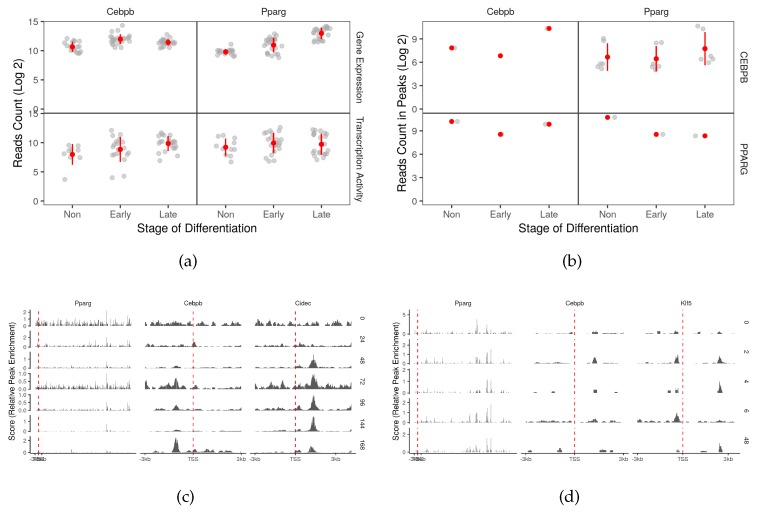
Figure 6.
Auto-regulation and feedback loops of the adipogenic transcription factors. (a) The reads count of two adipogenic transcription factor coding genes in RNA-Seq samples (n = 66) were used to represent the gene expression. The reads count in peaks of POLR2A in genomic region of two adipogenic transcription factor coding genes from ChIP-Seq samples (n = 12) was used to represent the transcription activity. (b) The reads count in peaks of CEBPB and PPARG ChIP-Seq samples was used to represent peak enrichment. The peaks from the (c) PPARG and (d) CEBPB ChIP-Seq samples were visualized by the time point and position around the transcription start site ( kb). Cidec and klf5 were used as positive control genes.

