Figure 3.
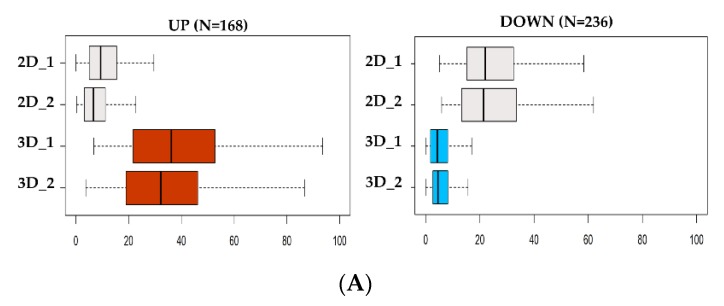
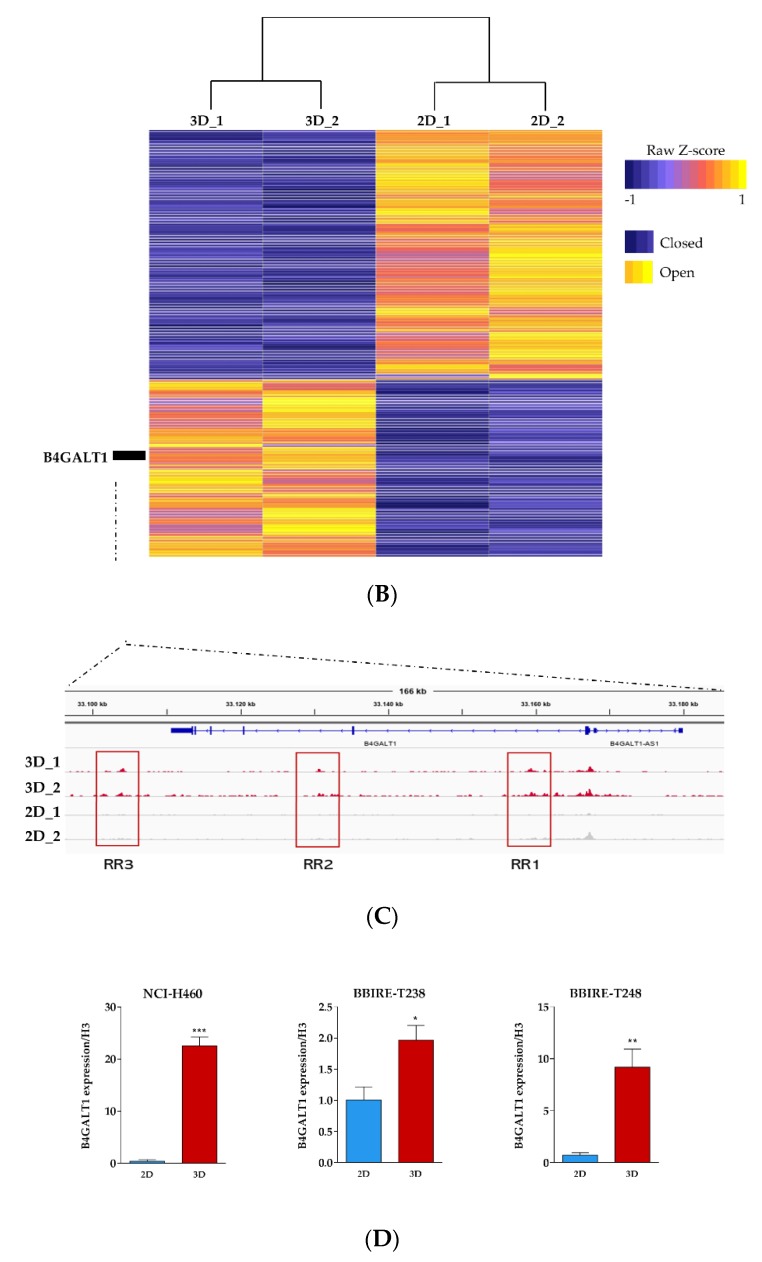
Analysis of DNA accessibility in 3D vs. 2D cultures. (A) ATAC-seq signal enrichment of normalized read counts at differential accessible sites in 3D vs. 2D (red = open; blue = closed). (B) Heatmap of differential chromatin accessibility sites (N = 404) showing the cell condition specificity of 2D and 3D ATAC-seq peaks. (C) Regulatory landscape of B4GALT1 locus. Peaks represent Assay for Transposase Accessible Chromatin with high-throughput sequencing (ATAC-seq) raw signals. (D) Reverse transcription polymerase chain reaction (RT-PCR) validation level of B4GALT1 upregulated in 3D cells compared to 2D culture in NCI-H460 (stable lung cell line) and BBIRE T-238, BBIRE T248 (primary lung cell lines). H3 reference gene have been used for normalization. Bars represent the mean of three biological replicates and technical replicates with their corresponding standard error of the mean (SEM). *** p < 0.0002; * p < 0.02; ** p < 0.0085.


