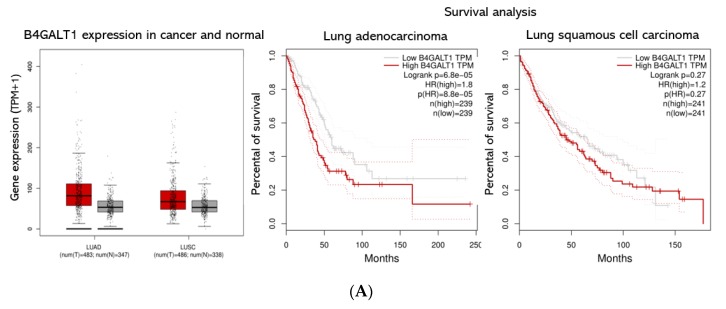
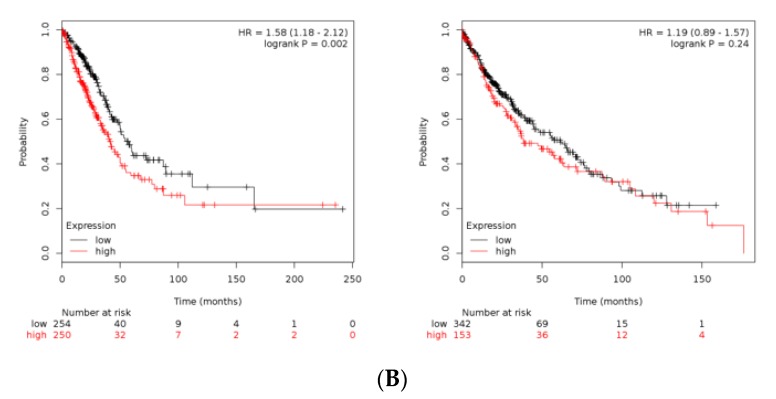
Figure 4.
B4GALT1 gene expression and survival analysis in lung adenocarcinoma (LUAD) and lung squamous cell carcinoma (LUSC) patients. (A) On the left panel is shown a Box Plot of B4GALT1 expression in lung adenocarcinoma (LUAD) and lung squamous cell carcinoma (LUSC). Each dot represents a patient. (red: cancer tissues; grey: healthy tissues). On the right panel is shown a survival curves depict the B4GALT1 prognostic value in LUAD (N = 239 high expression tissues +239 low expression tissues) and LUSC cohort (N = 241 high expression +241 low expression). Comparison of survival curves was performed using a log-rank (Mantel–Cox) test. HR = Hazard ration. Dotted lines represent the 95% of Confidence Interval. (B) Kaplan–Meier curves depict the cumulative prognostic value of B4GALT1 and SCD1 gene expressions in LUAD (N = 250 high expression tissues + 254 low expression tissues) and LUSC (N = 153 high expression tissues + 342 low expression tissues) Abbreviations: LUAD, lung adenocarcinoma; LUSC lung squamous cell carcinoma; num, number; T, tumor; N, normal.


