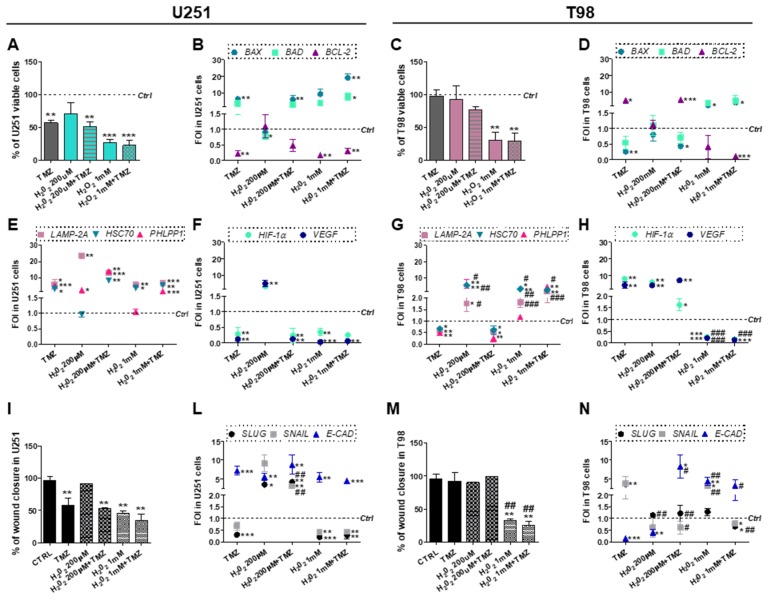
Figure 5.
Role of oxidative stress in overcoming Temozolomide resistance. (A) Viability analysis and (B) gene expression profile for apoptotic-related genes (BAX, BAD and BCL-2) in U251 and (C,D) in T98 cells. Viability was assessed by means of Trypan blue exclusion test after treatment with 200µM or 1mM H2O2 ± 100 µM Temozolomide (TMZ). Data of viability were expressed as percentage of viable cells; ** p < 0.01; *** p < 0.001 treated vs. control cells. (E) Gene expression profile for CMA-related genes (LAMP2A, HSC70, PHLPP1), and for (F) HIF-1α and VEGF in U251 and in (G,H) T98 cell after treatment with 200 µM or 1 mM H2O2 ± 100 µM TMZ. * p < 0.05; ** p < 0.01; *** p < 0.001 treated vs. control cells. All data of gene expression were normalized for β-ACTIN, and the ΔΔCt values were expressed as FOI of the ratio between treated and control cells. * p < 0.05; ** p < 0.01; *** p < 0.001 treated vs. control cells. # p < 0.05, ## p < 0.01, ### p < 0.001 vs. TMZ-treated cells. (I) Scratch test and (L) gene expression for EMT-related genes (SLUG, SNAIL, E-CAD) performed after treatments in U251 and (M,N) T98 cells. Wound closure percentage compared to control was analyzed with Image J software. ** p < 0.01 treated vs. control cells. ## p < 0.01 vs. TMZ-treated cells. Data of gene expression were normalized and expressed as mentioned above. * p < 0.05; ** p < 0.01; *** p < 0.001 treated vs. control cells. # p < 0.05, ## p < 0.01, ### p < 0.001 vs. TMZ-treated cells.

