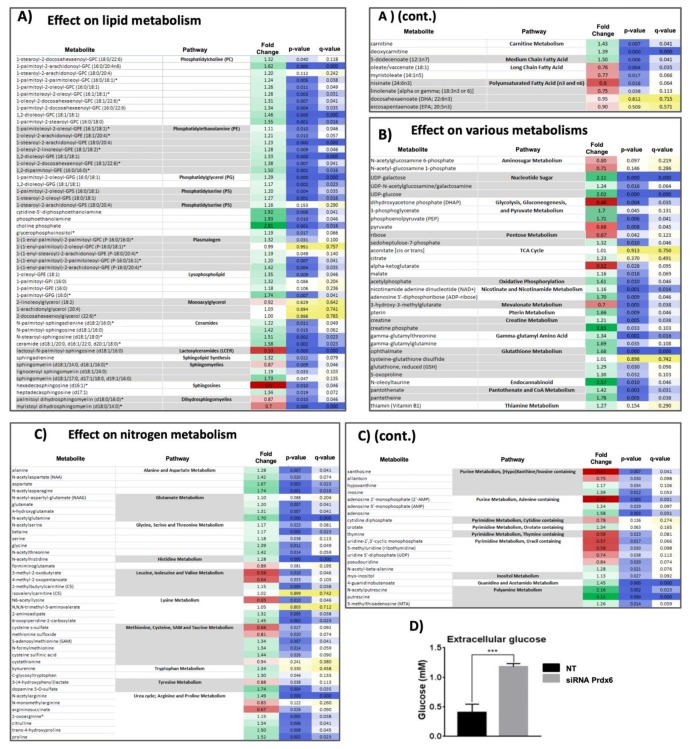
Figure 2.
Summary of significant metabolomic changes. A metabolomic analysis was carried out as described in Materials and Methods. The fold change (up-regulation, green; down-regulation, red) of each metabolite level on Prdx6 silencing in HepG2 cells is shown in the first column; the second and third columns show the p-values and q-values, respectively, for statistical significance; p and q-values ≤0.05 are in blue with the color intensity inversely proportional to p- or q-value. The results have been clustered into three figures and into pathways therein: (A) Metabolites of lipid metabolism; (B) metabolites of other pathways and (C) metabolites of aminoacids and nucleotides metabolism. (D) The concentration fold change of extracellular glucose determined by standard colorimetric methods in three independent experiments (*** p < 0.001).

