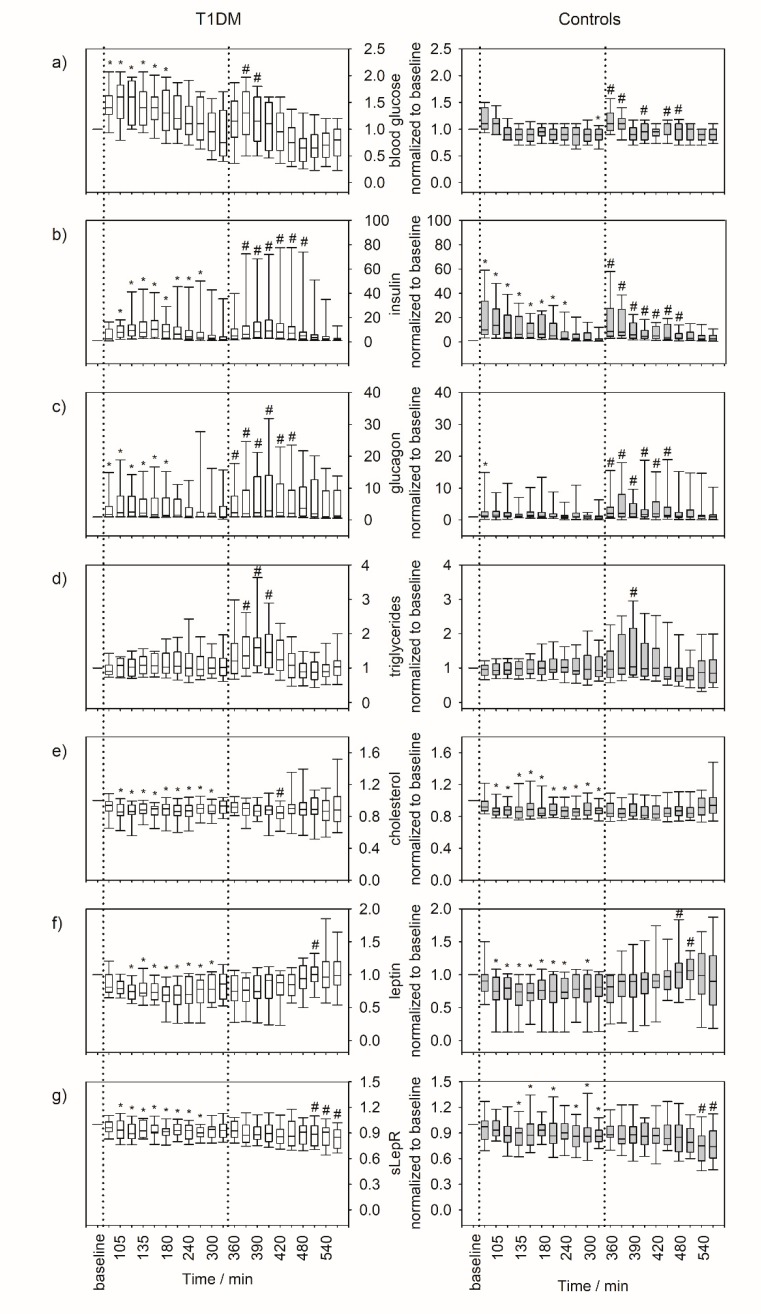
Figure 3.
Box plots of serum parameters over the course of nine hours. (a) Blood glucose, (b) insulin, (c) glucagon, (d) triglycerides, (e) cholesterol, (f) leptin, and (g) sLepR. The graphs on the left show the course over of the nine hours of the experiment for T1DM patients (n = 22), the graphs on the right show the corresponding data from healthy controls (n = 22). Data were normalized to the baseline value (before breakfast) to emphasize relative changes and minimize inter-individual variation. Lunch was taken after the measurement at the 330th minute. Dotted lines indicate the intake of standardized meals. The asterisks (*) indicate statistically significant changes versus baseline (before breakfast) and hashes (#) indicate statistically significant changes versus the 330th minute (last measurement before lunch).

