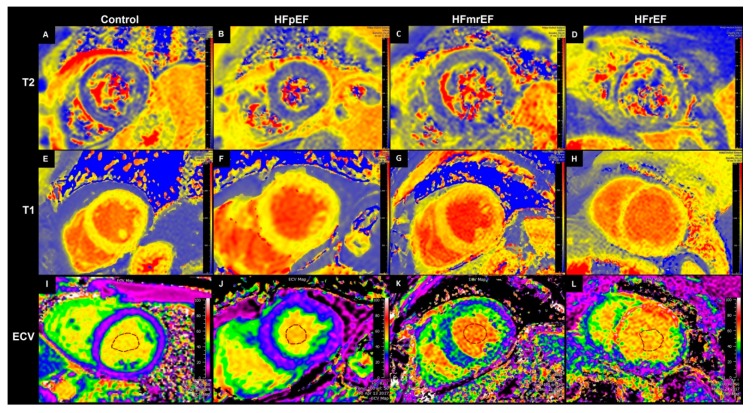
Figure 1.
Exemplary medial short axis images of T2 relaxation time maps (first row, (A–D)), T1 relaxation time maps (second row, E–H) and extracellular volume (ECV) maps (third row, (I–L)). First column (A,E,I): Healthy control (ECV image from a patient from clinical routine, as no contrast agent was given to healthy controls in our study). Second column (B,F,J): Patient number 3 (HFpEF). Third column (C,G,K): Patient number 9 (HFmrEF). Fourth column (D,H,L): Patient number 11 (HFrEF). Segments with scars excluded from analysis. ECV = Extracellular volume. HFmrEF = Heart failure with moderately reduced Ejection fraction, HFpEF = Heart failure with preserved ejection fraction, HFrEF = Heart failure with reduced ejection fraction.

