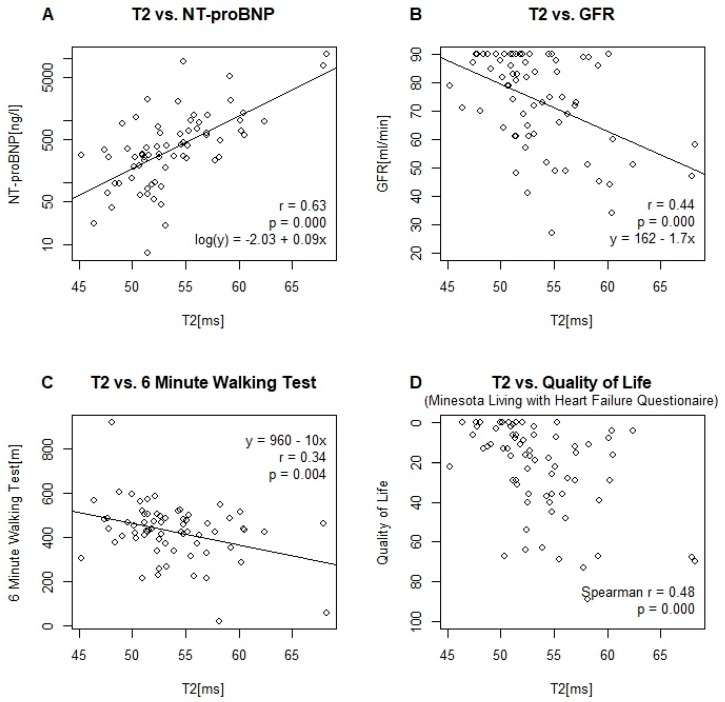
Figure 3.
Scatter Plots and linear model parameters of T2 relaxation time versus (A) NT-proBNP (logarithmic scale), (B) glomerular filtration rate (GFR) and (C) 6 min walking test. (D) Scatter plot and Spearman’s correlation coefficient of T2 relaxation time versus quality of life, as assessed by the Minnesota Living with Heart Failure Questionnaire.

