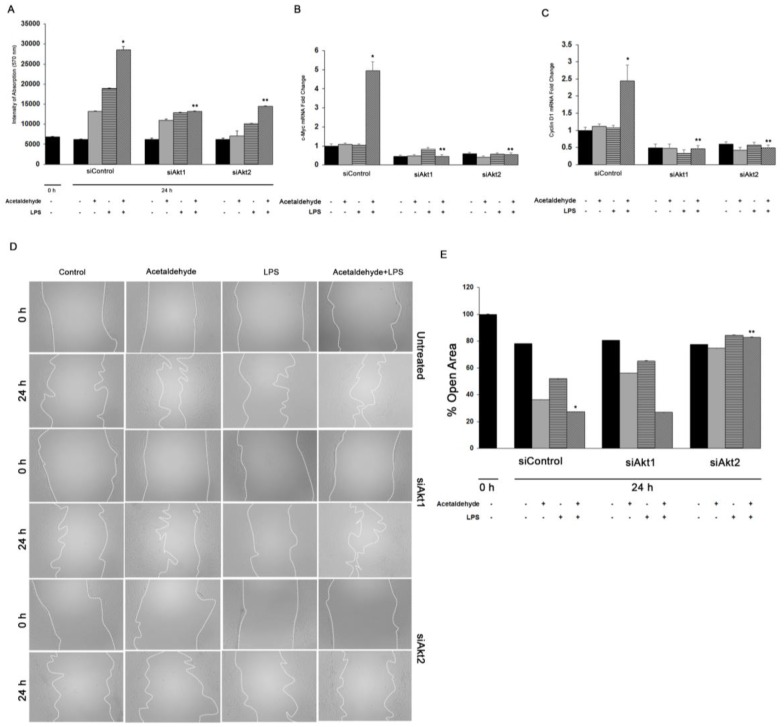
Figure 5.
Role of Akt1 and Akt2 in HSC proliferation and migration. (A) Cell proliferation was performed by MTT assay of human HSC transfected with siAkt1 or siAkt2 and treated for 3 h with acetaldehyde, LPS, or both. Quantitative qPCR analysis of (B) c-Myc and (C) Cyclin D1 was performed with total RNA obtained from human HSCs. All values are means of triplicate experiments ± SE after correcting for the expression of S18. (D) Cell migration was determined after wounding a confluent culture and measuring the gap area at the time points indicated in the figure. Panel E shows percent of open area. Values are means of triplicate experiments ± S.E. * p < 0.05 as compared to control, ** p < 0.05 as compared to acetaldehyde and LPS.

