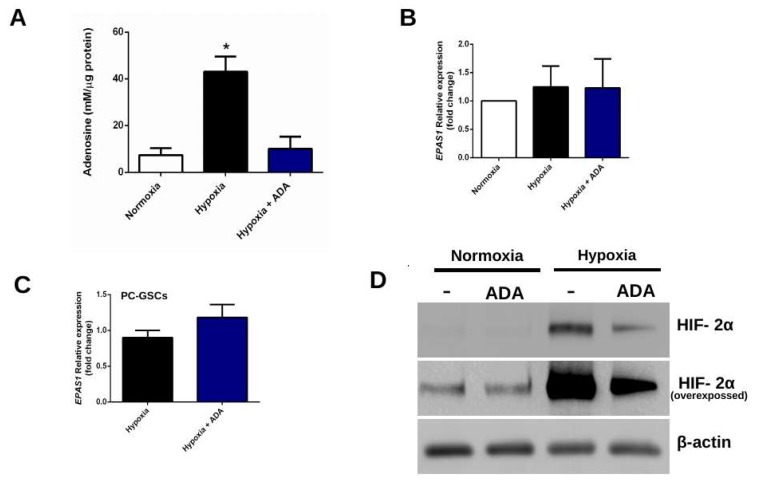
Figure 1.
HIF-2α levels under hypoxia and adenosine depletion. (A) Extracellular adenosine quantification of U87-GSCs under hypoxia treated with 1 U/mL ADA for 24 h. Adenosine concentration (nM) was normalized to total protein levels (μg) (B) EPAS1 (HIF-2α) transcript levels of U87-GSCs under hypoxia and 1 U/mL ADA for 24 h were measured by RT-qPCR (C) Same as in B, but with PC-GSCs (D) HIF-2α protein levels of U87-GSCs under normoxia or hypoxia treated with 1 U/mL ADA for 24 h were analyzed by western blot. n = 3, *p < 0.05.

