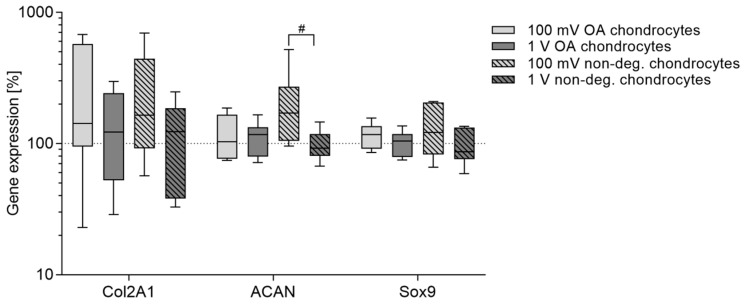
Figure 5.
Relative gene expression of chondrogenic differentiation markers in human chondrocytes after electrical stimulation with 100 mV and 1 V at 1 kHz. Chondrocytes derived from non-degenerative (n = 4) or osteoarthritic (OA) cartilage (n = 6) were seeded on collagen scaffolds and electrical stimulation was performed over a period of seven days. Afterwards, RNA was isolated to determine the gene expression of chondrogenic differentiation markers via semi-quantitative polymerase chain reaction (qPCR). Data are presented as boxplots of the percentage of 2(−ΔΔCt) related to unstimulated cells (100%). Statistical analysis within a stimulation group was performed with Friedman test by using the ΔΔCt-values (# p < 0.05).

