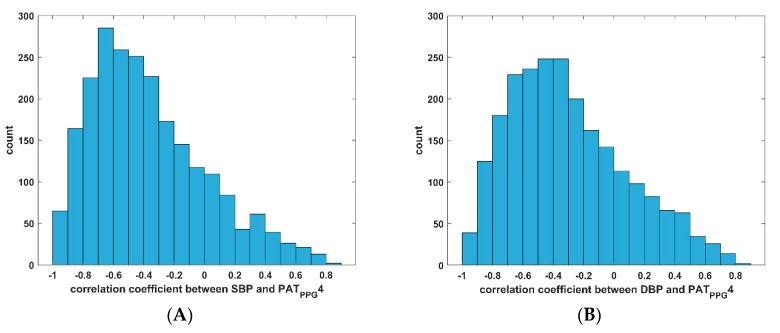
Figure 6.
Histogram of the Pearson correlation coefficients between BP and PATppg4 of 2309 subjects. (A) Histogram of Pearson correlation coefficient between PATPPG4 and SBP; (B) Histogram of Pearson correlation coefficient between PATPPG4 and DBP. SBP, systolic blood pressure; DBP, diastolic blood pressure; PAT, pulse arrival time.

