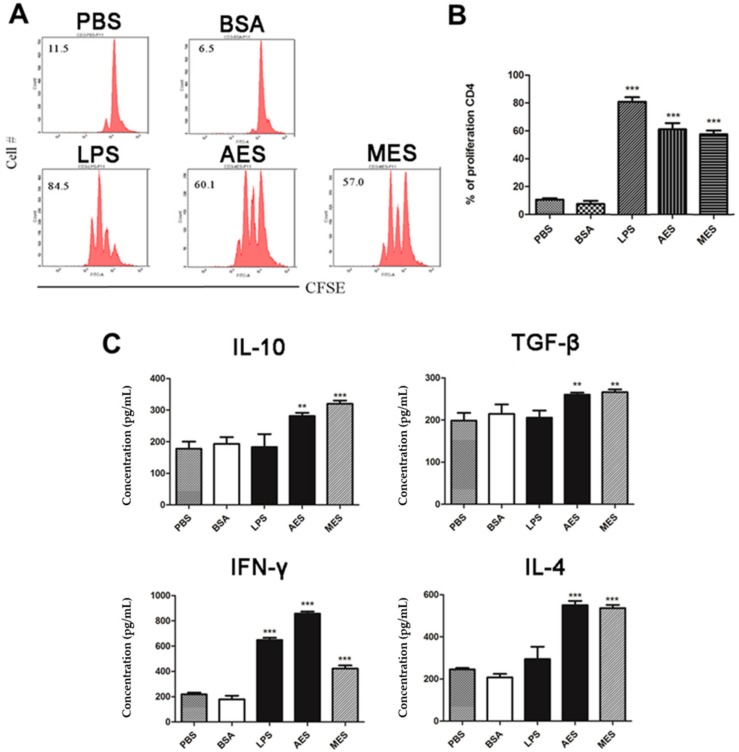
Figure 6.
Proliferation and cytokines production of T cells in response to T. spiralis ES (TsES)-treated DCs: CD4+ T cells were isolated from splenocytes of T. spiralis-infected BALB/c mice, labeled with CFSE, and co-cultured for 72 h with BMDCs (stimulated with PBS, BSA, LPS, AES, or MES) in the presence of anti-CD3/anti-CD28. (A,B) FACS of T cells proliferation from one experiment of three independent experiments is presented. (C) Cytokine levels were measured in cell culture supernatants using ELISA. Data are expressed as means ± SDs from three independent experiments. Each experiment was done in triplicates. ** p < 0.01; *** p < 0.001, compared to the PBS control.

