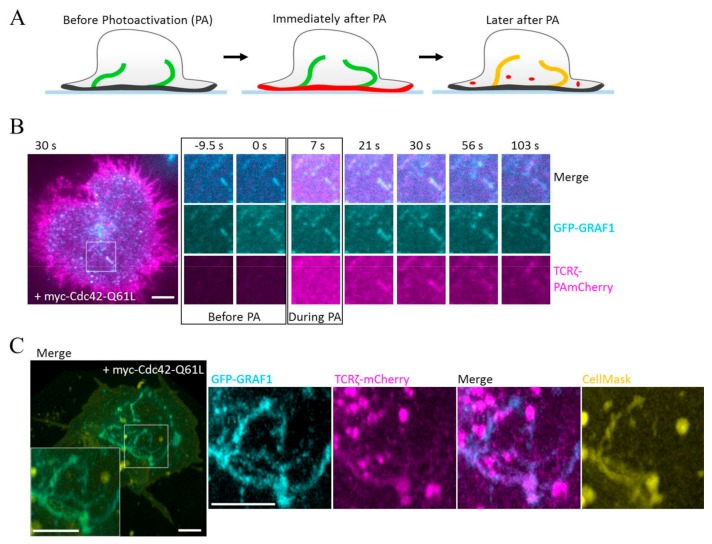
Figure 3.
(A) Schematic of the PAmCherry-based internalization assay; PAmCherry is photoactivated at the plasma membrane using TIRF illumination for 10 sec. Incorporation of TCRζ-PAmCherry is visualized by the increase in red fluorescence intensity in the GFP-GRAF1 positive tubules. (B) Representative time series of the dynamics of the TCRζ-PAmCherry signal before, during, and after photoactivation in Jurkat T cells activated on an antibody-coated coverslip in TIRF illumination. (C) Representative image of GFP-GRAF1 and TCRζ-mCherry positive tubules stained with the membrane dye CellMask at 4 °C followed by fixation with PFA at 37 °C. Scale bar: 5 μm.

