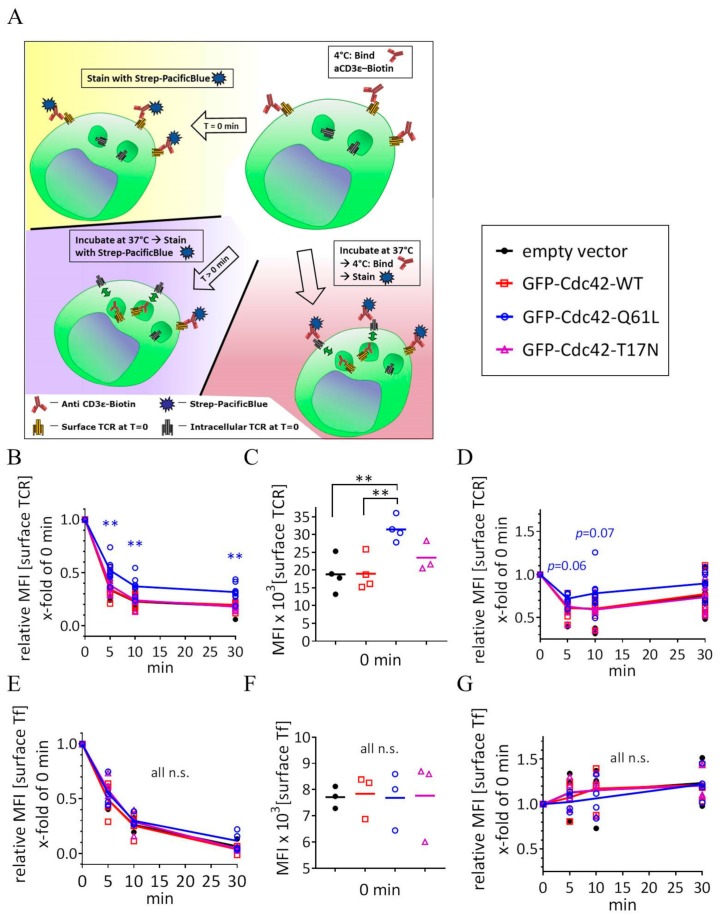
Figure 4.
Expression of Cdc42-Q61L selectively impairs internalization of the TCR-CD3 complex. (A) Schematic of the flow-cytometry based internalization assay; cells are labelled at 4 °C with a functional biotinylated anti-CD3ε and either (yellow) directly stained with Pacific Blue-streptavidin to measure surface expression of TCR-CD3 complex in resting cells, (blue) activated by incubation at 37 °C and stained with Pacific Blue-streptavidin to detect remaining TCR-CD3 at the cell surface after activation-induced internalization, or (red) activated by incubation at 37 °C, re-labelled with biotinylated anti-CD3ε and stained with Pacific Blue-streptavidin to detect total surface TCR-CD3 in activated cells. (B) Remaining TCR-CD3 at the cell surface detected by an antibody against CD3ε (clone OKT3) after activation-induced internalization in cells expressing an empty vector, GFP-WT-Cdc42, GFP-Cdc42-Q61L, or GFP-Cdc42-T17N. (C) Surface expression of TCR-CD3 complex in cells expressing the same constructs as in (B). (D) Total surface TCR-CD3 in activated cells transfected as in (B). (E) Internalization of biotinylated Tf detected with Pacific Blue-streptavidin after incubation at 37 °C as described for anti-CD3ε in (A), in cells activated by soluble anti-CD3ε and expressing the same constructs as in (B). (F) Surface expression of Tf in cells expressing the same constructs as in (B). (G) Total Tf at the cell surface detected with biotinylated Tf and Pacific Blue-streptavidin in activated cells as in (F). Each data point represents the mean of an individual experiment. Small horizontal lines indicate mean (±SEM), ** p < 0.01, n.s. not significant, unpaired, two-tailed student’s t-test.

