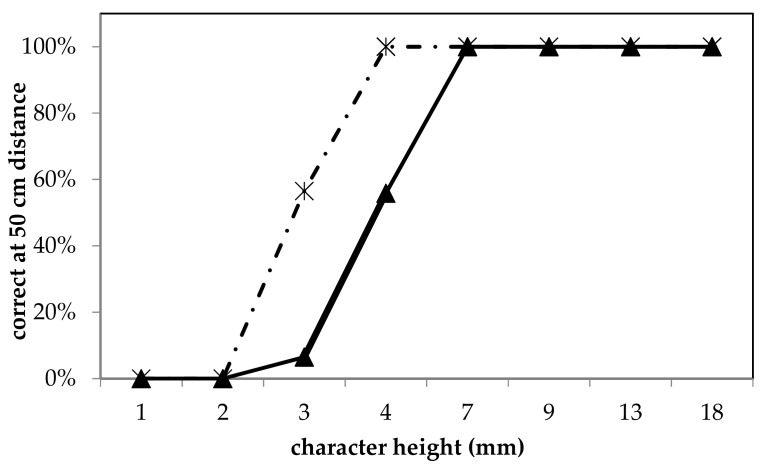
Figure 8.
Snellen chart vision test, describing the percentage of correct letter individuation in relation to its dimension. The two streaming video qualities are reported 3G (continuous line) and 4G (dashed line). The test was performed through F4 smart glasses at 50 cm distance from the chart. Reading was carried out on a 16 inches display.

