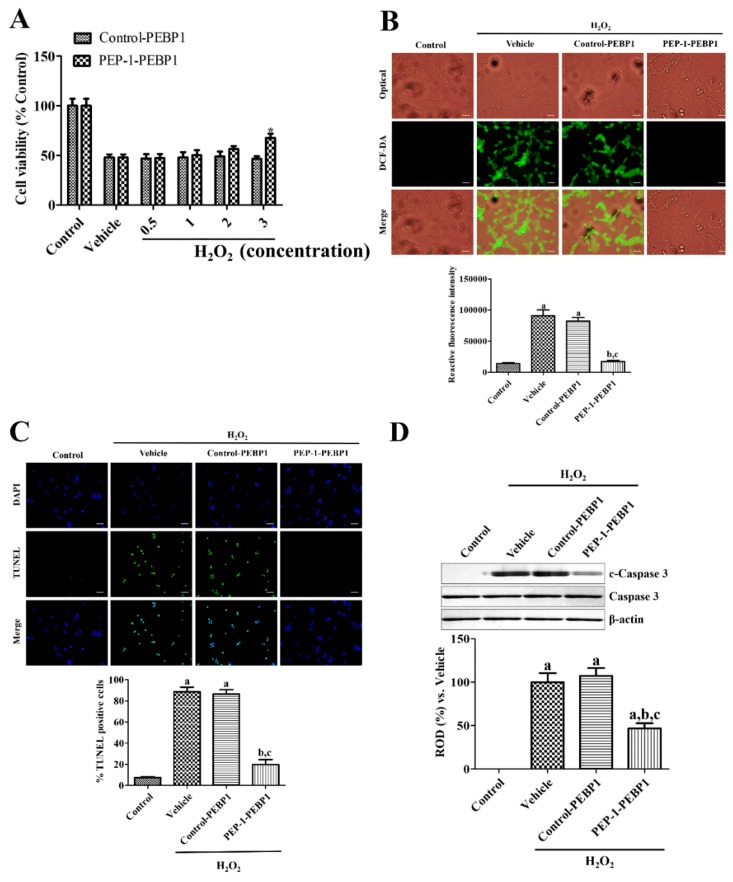
Figure 3.
Protective effects of PEP-1-PEBP1 and control-PEBP1 proteins on oxidative damage induced by 1 mM H2O2 treatment in NSC34 cells. (A) ELISA assay results for dose-dependent (0.5–3 μM) viability of NSC34 cells analyzed by WST-1 assay. (B) Immunofluorescent staining for DCF-DA and measurement of ROS production using a fluorescence plate reader. (C) Immunofluorescent staining for TUNEL and quantitative analysis of TNINEL positive cells by cell counting under a phase-contrast microscopy. Scale bar = 50 μm (B and C). (D) Western blot analysis for caspase 3 and cleaved caspase 3 (c-caspase 3) in the NSC34 lysates. Data were analyzed by Student t-test (* p < 0.05, significantly different from the control-PEBP1-treated group) or one-way analysis of variance followed by a Bonferroni’s post-hoc test (a p < 0.05, significantly different from the control group; b p < 0.05, significantly different from the vehicle-treated group; c p < 0.05, significantly different from the control-PEBP1-treated group). The bars indicate mean ± SEM.

