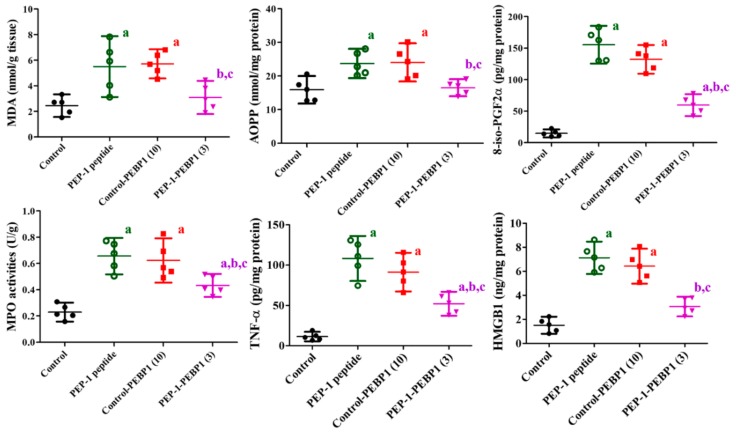
Figure 6.
Effects of Control-PEBP or PEP-1-PEBP1 on MDA, AOPP, 8-iso-PGF2α, MPO, TNF-α, and HMGB in the spinal cord 72 h after ischemia/reperfusion (n = 5 per group; a p < 0.05, significantly different from the control group, b p < 0.05, significantly different from the PEP-1 peptide-treated group, c p < 0.05, significantly different from the control-PEBP1-treated group). The bars indicate confidence interval.

