
Figure 2.
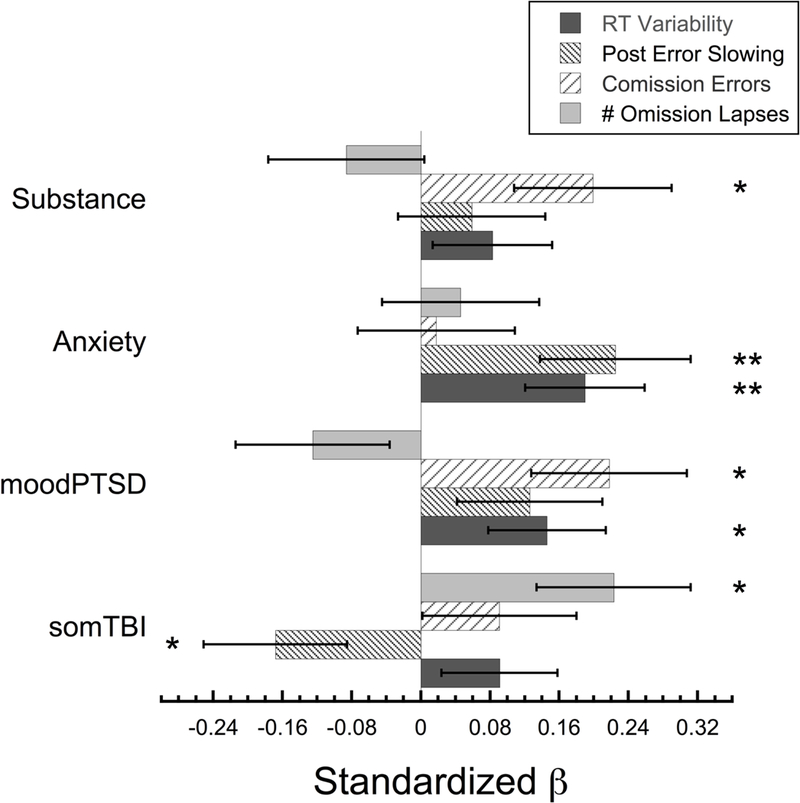
Bar graph showing the standardized beta-weights for each of the four clinical components used to predict performance on the gradCPT sustained attention task. For clarity, only the performance variables where the overall regression model was significant are shown. This includes reaction time variability (standard deviation of the reaction time), post-error slowing, commission error rate, and the number of omission lapses. Error bars show ±1 S.E.M. * = p < 0.05, ** p ≤ 0.01.