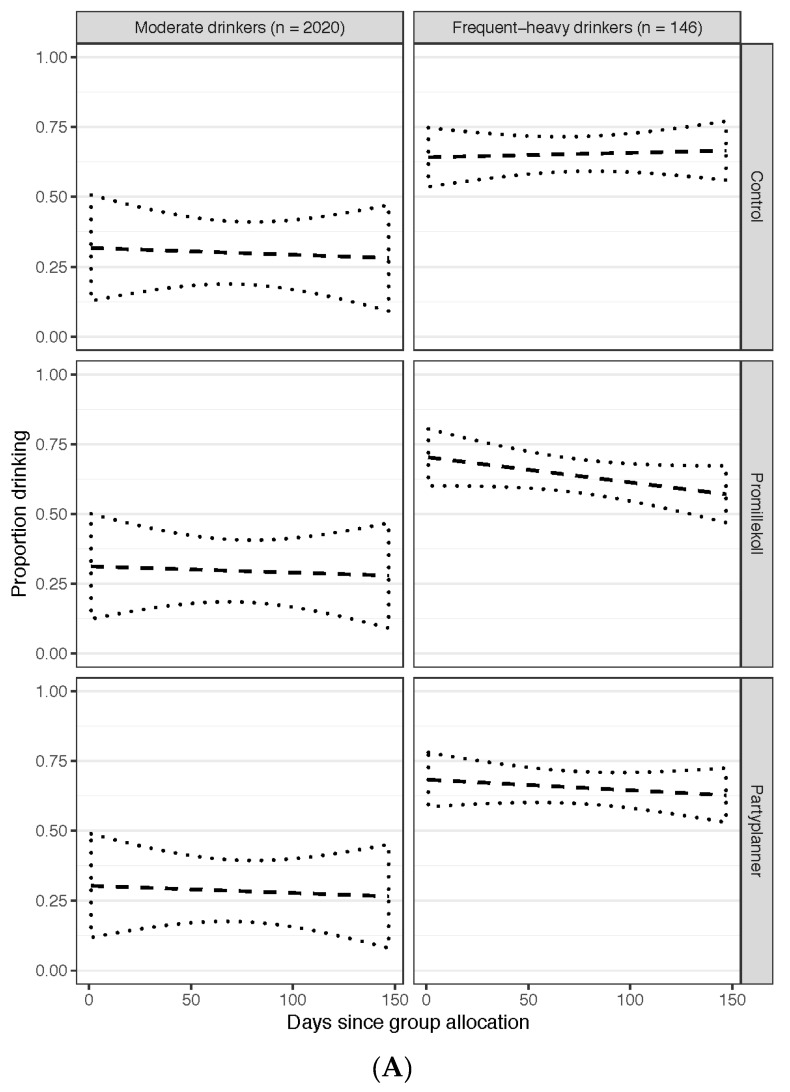
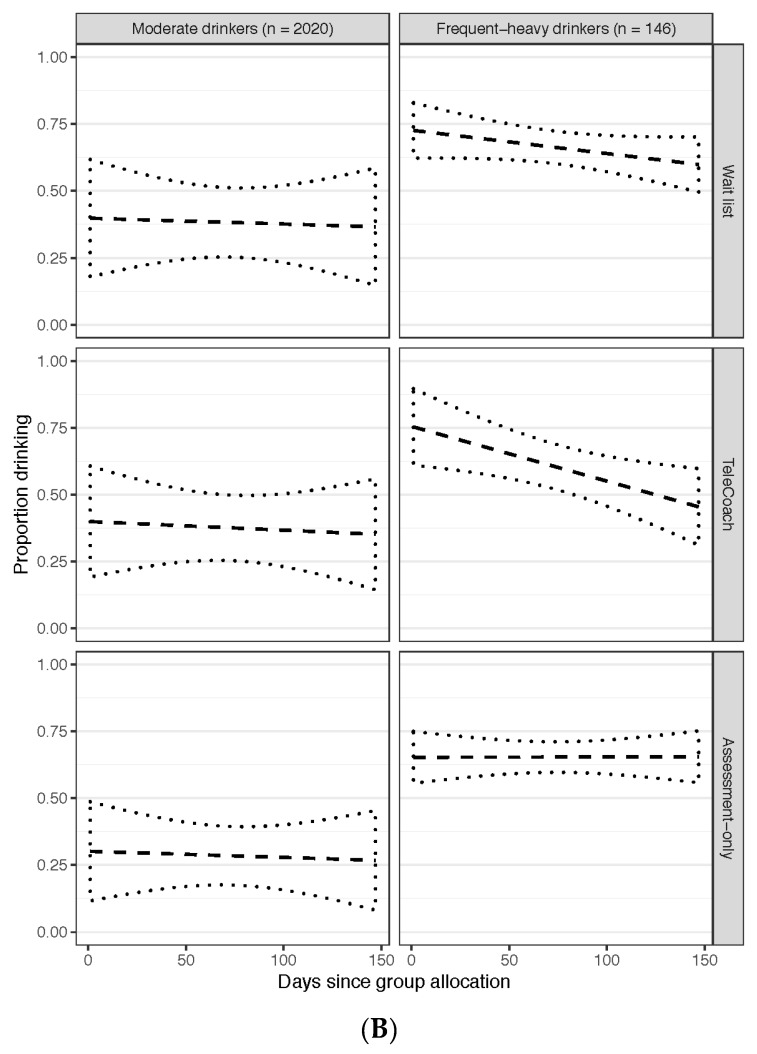
Figure 3.
The proportion of students drinking alcohol (vertical axis) during any of the measurement weeks (horizontal axis; baseline, 7, 14, and 20 week follow-ups). (A) The left-hand column comprises three plots presenting data from moderate drinkers in the assessment-only control condition), Promillekoll eBAC app, and PartyPlanner eBAC app; the right-hand column presents the data from the frequent-heavy drinkers in the same study arms. (B) The left-hand column comprises three plots presenting data from moderate drinkers in the wait list, TeleCoach, and assessment-only conditions; the right-hand column presents the data from the frequent-heavy drinkers in the same study arms. A linear trend line (dashed) with 95% confidence interval of the trend line (dotted) has been included in each plot.


