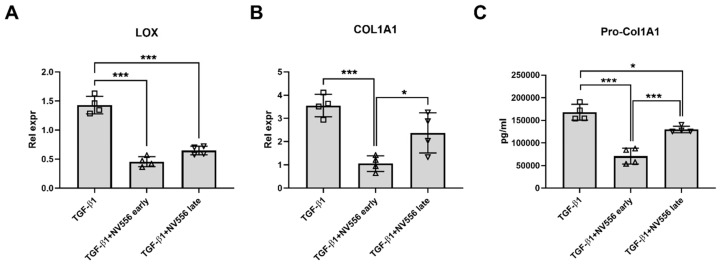
Figure 4.
NV556 effect on gene expression (A,B) and procollagen secretion (C) in a 3D human liver model reseeded with LX2 cells. Data in A and B are represented as mean of relative expression over nontreated control cells ± SD and Data in A–C are statistically analyzed by one-way ANOVA, followed by Tukey’s multiple comparison test. *p < 0.05, **p < 0.01 and ***p < 0.001, n = 4 scaffolds per condition investigated.

