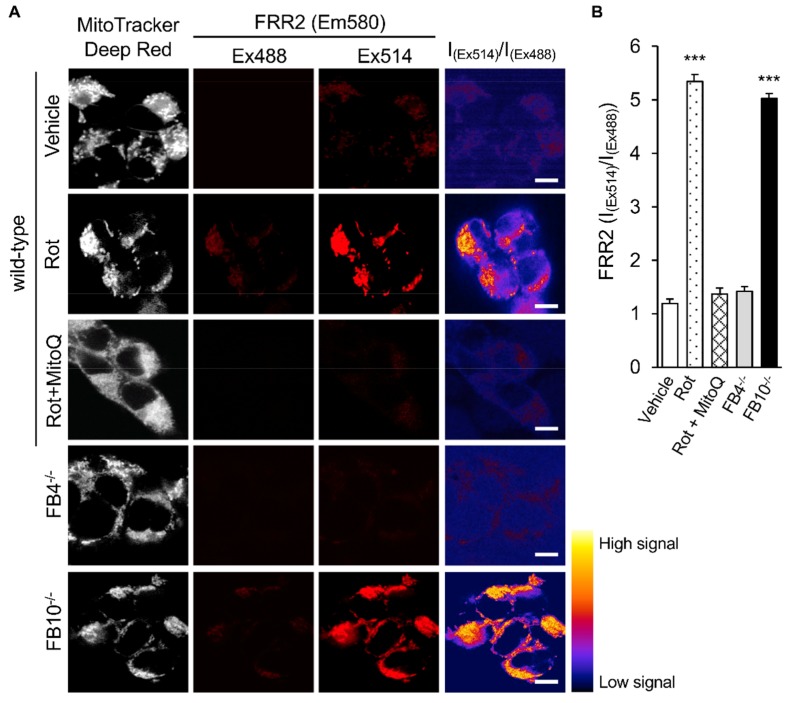
Figure 2.
Knock-out of mitochondrial complex I β subcomplex subunit 10 results in elevated mitochondrial reactive oxygen species (mtROS) generation. HEK293T cells and KO derivative lines FB4−/− or FB10−/− were assessed for mtROS generation. Wild-type cells treated with mitochondrial Complex I inhibitor rotenone (Rot, 0.5 µM), Rot (0.5 µM) for 1 h, followed by mitoquinone mesylate (MitoQ) (1 µM) for a further 1 h or a dimethyl sulfoxide (DMSO) vehicle for 2 h are shown for comparison. (A) Cells were stained for Mitotracker Deep Red (white; 100 nM, 15 min) and the mitochondria-specific ROS probe flavin-rhodamine redox sensor 2 (FRR2, red; 2 µM, 15 min), followed by live cell imaging by resonant scanning confocal laser scanning microscopy (CLSM). Colocalisation for Mitotracker Deep Red and flavin-rhodamine redox sensor 2 (FRR2) staining at either Ex488 or Ex514 was >85% (Pearson correlation coefficient [33]) across all samples (25–30 cells/sample). The I(Ex514)/I(Ex488) images (far right) are calculated by a pixel-wise division of the 514 nm (third column) and 488 nm (second column) emission image channels and represented in pseudo-colors (intensity color key displayed lower right). Results are typical of n = 3 independent experiments. In all panels, scale bar = 10 µm. (B) FRR2 (I(Ex514)/I(Ex488)) was calculated for the mitochondrial regions defined by Mitotracker Deep Red staining in the I(Ex514)/I(Ex488) images, such as those in (A) using a custom CellProfiler pipeline (see Methods). Results represent the mean + SEM for n = 3 independent experiments, where each experiment analyzed 25–30 cells per sample. *** p < 0.001 compared to the wild-type cells.

